This is the tenth and last post describing our RV power system. Our previous post described the final design and some of its characteristics. This post summarizes the system’s performance on our first overnight outing. First, for convenience, we briefly describe the final system. Next, we describe our outing and associated conditions and finally explain the system’s performance.
Final System
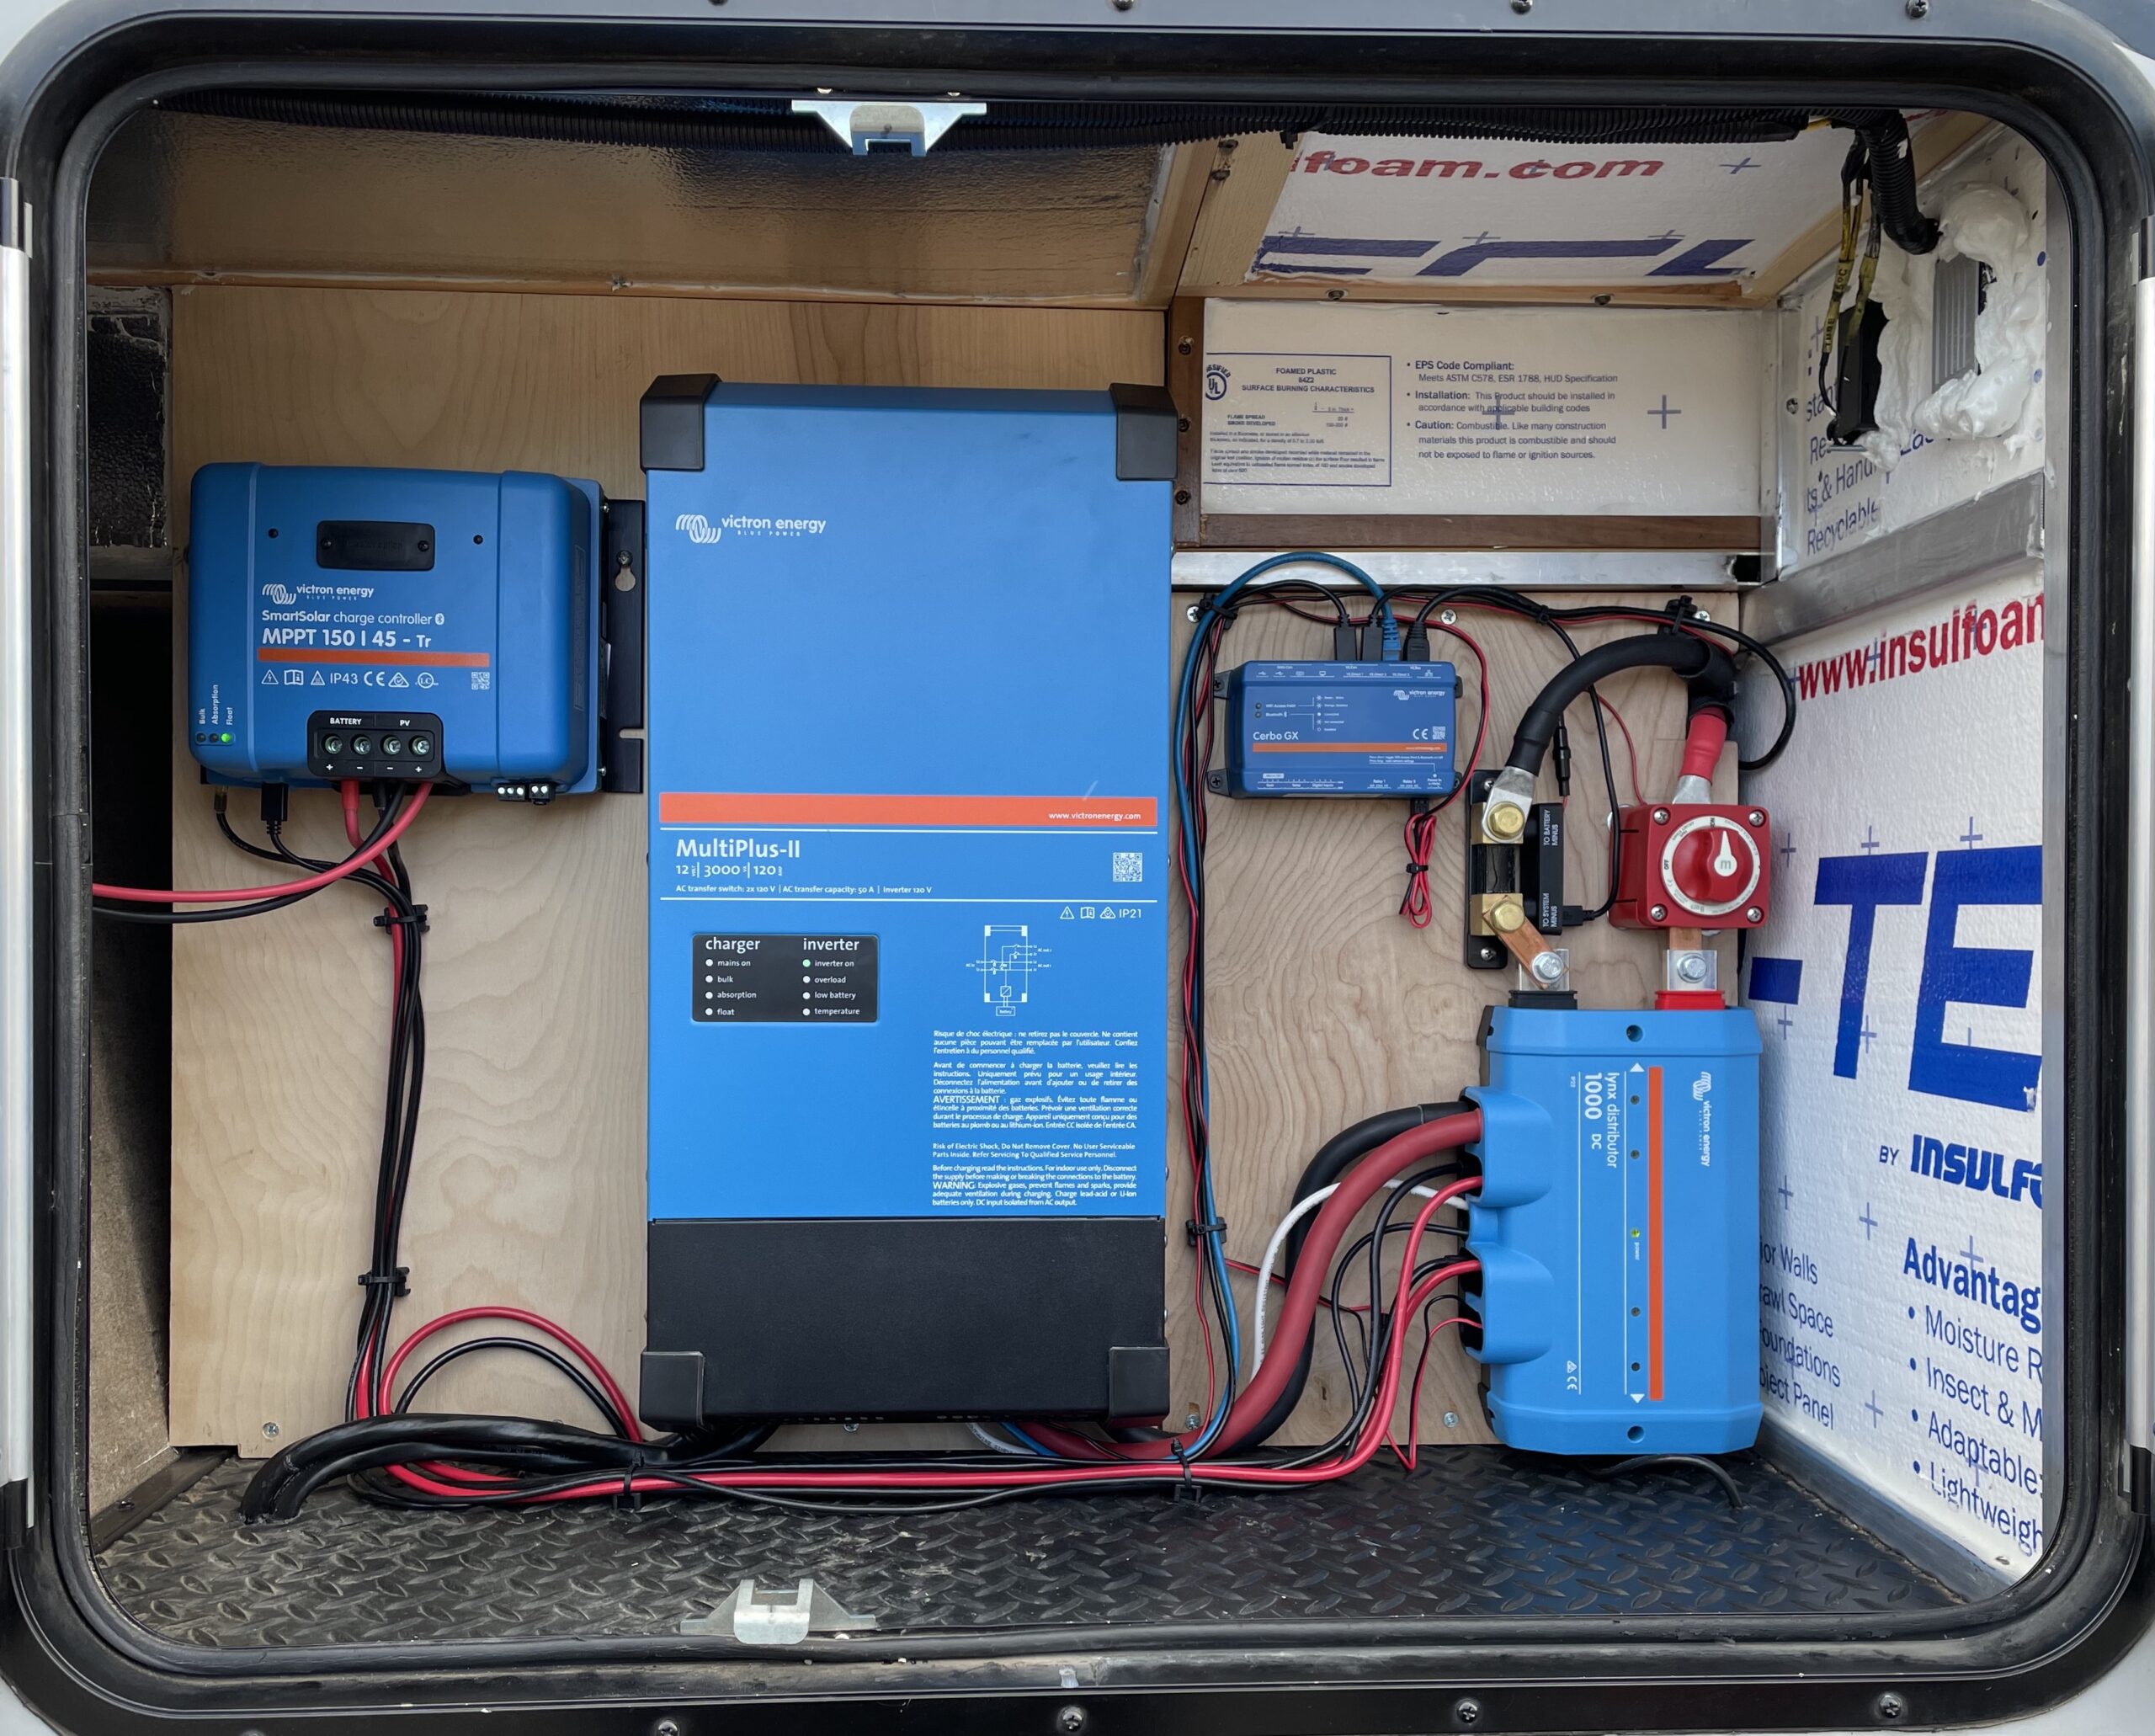
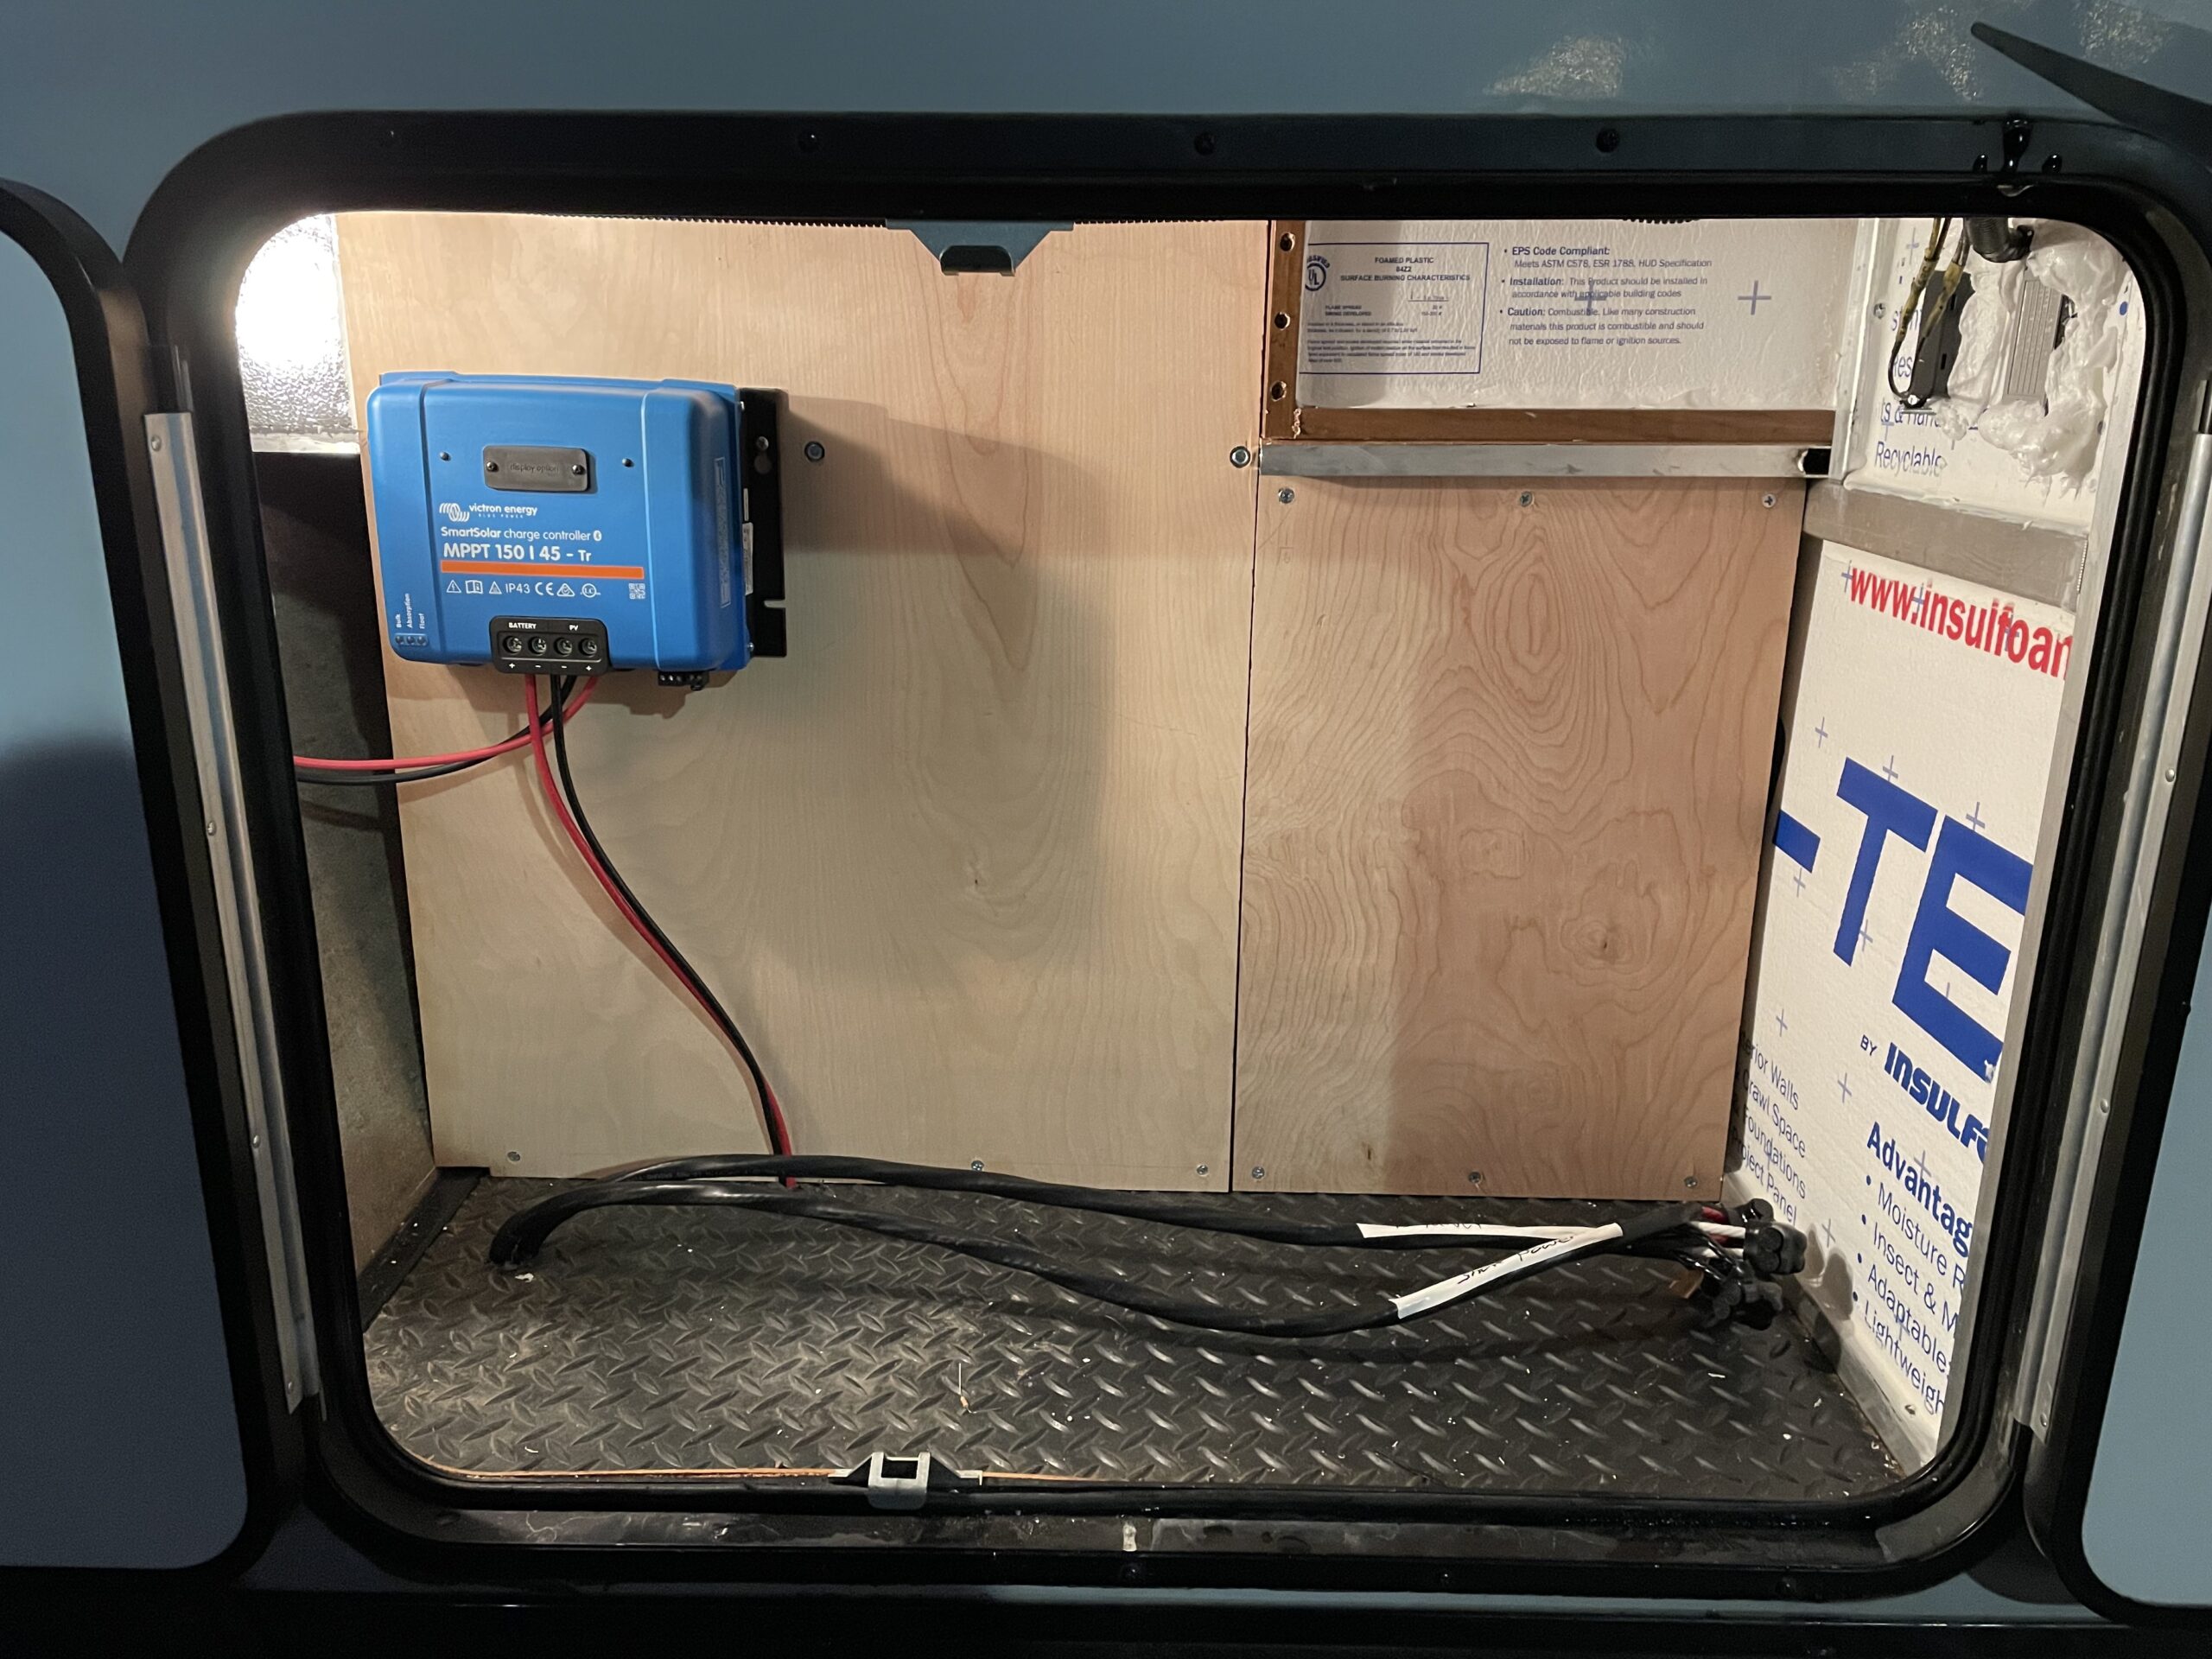
Our power system fits within the left pass-through storage area, illustrated in Figure 1.
Figure 1 illustrates our complete power center providing 800 W of solar, 360 Ah of Lithium-ion batteries, and a 3kVA invert/charger.
Figure 1 illustrates the major components of our system. There are seven major components illustrated from upper left to lower right:
Solar PV disconnect switch
Victron SmartSolar 150/45 solar charger
Victron MultiPlus-II 2x 120V inverter/charger
Victron Cerbo GX monitoring system
Victron SmartShunt
Blue Sea battery switch
Victron Lynx Distributor
Our 360 Ah battery bank is behind and to the right of this location. The solar charger and the SmartShunt attach to the Cerbo GX via VE.Direct cables. The battery voltage monitor (mounted on the battery bank) and the MultiPlus-II connect to the Cerbo GX via two VE.Bus cables.
Our Outing – Red Canyon, Utah
We spent two nights in Red Canyon Campground in southern Utah in late April. This outing is described in more detail in another post. The daytime temperatures were in the mid-60s, and the lows were in the low-20s. The sun was bright the first day. We had a couple of hours of good sunlight on the second day and then overcast with rain.
Performance
With the nighttime temperatures in the 20s, our furnace periodically ran to keep the trailer at approximately 65 degrees. In addition, we watched television for several hours at night, used lights, and charged a couple of phones, watches, and an iPad. With all of these devices running and charging, we consumed nearly 80 Ah of our 360 Ah battery bank. Our batteries were replenished after just a few hours of good sunlight.
Early in the day, the solar charging system produced about 360 W. I decided to check the cleanliness of the solar panels and was shocked to find them coated in mud. It was thick enough that I could not remove it without a significant amount of water. After cleaning the panels, the system produced just over 500 W. A little water and elbow grease pay off.
Figure 2, our electric fireplace.
After a 5 mile hike, we returned to find our RV an uncomfortable 81 degrees. We flipped on the AC and set the thermostat to 75. The AC drew a constant 1100 W and ran for approximately 30 minutes. Later that evening, the temperature in the RV dipped down to about 68 while we were still up and around, so we turned on the electric fireplace. That unit drew nearly 1400 W but warmed us right up. We tried a few other electric devices to see the practicality. The refrigerator on electric power drew about 22 A, my wife’s curling iron was no big deal at 200 W, and I’ve tried the microwave before at just over 1000 W.
It is a pleasure to use all of our systems without generating noise. We can use the AC, microwave, and TV after campground quiet hours without worrying about bothering others. However, it is funny watching us adapt to this new world. Are we content toasting our bread in the broiler? Of course not; we need a toaster because we can have one! I am sure we’ll add a hairdryer and who knows what else. Nevertheless, I am pleased with the outcome and the comfort it has added to our lives.
This is the ninth post of a series of articles documenting and describing our RV electrical upgrade. Our previous post in this series described a simplified model of our battery bank, the wiring of our system, the resistance contributed by each component and associated cables, and the expected system voltage drop. Our goal is to keep our voltage drop to 2.5% or less as recommended in Victron’s Wiring Unlimited. This post describes the outcome, reports actual voltage drop measurements, and compares these with those calculated previously. Finally, we evaluate our final results regarding our initial goals, point out a few things we’d do differently, and conclude. For those interested, this page lists the parts, equipment, and tools we used to build our power system.
Initial Design
Figure 1 illustrates the power system proposed in a previous post.
The power system we built, illustrated in Figure 1, was initially proposed in one of our first posts in this series. In our previous post, we introduced the critical path of this system consisting of the circuit from the battery bank to the inverter/charger and back, illustrated in Figure 2.
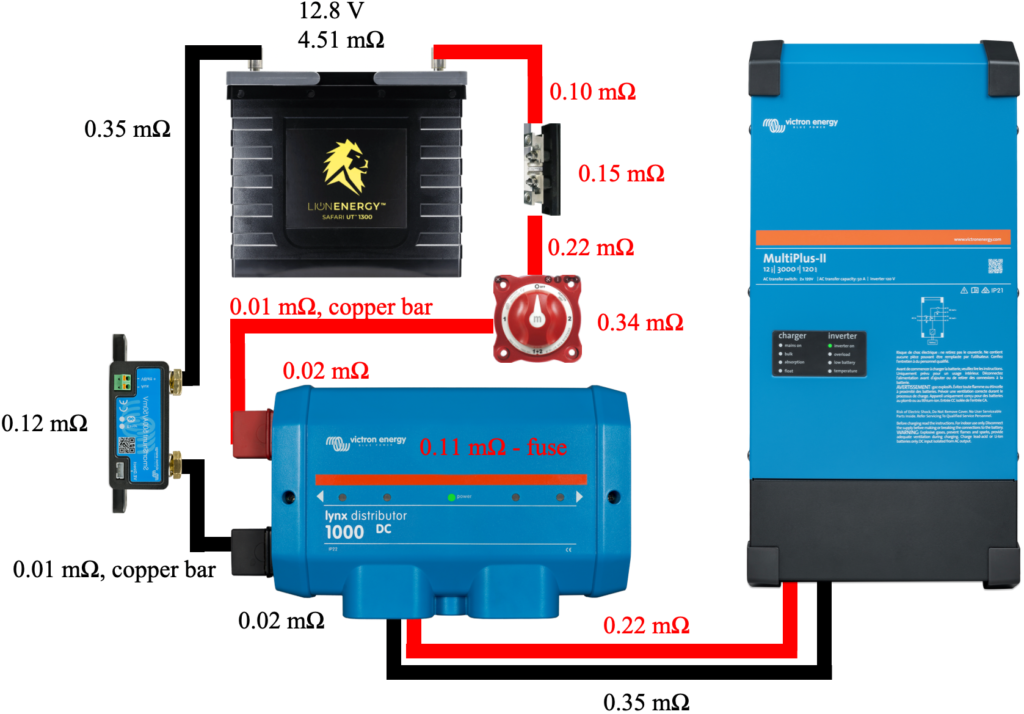
Figure 2 illustrates the components and cables that make up our system’s critical path and associated resistance values.
Figure 2 includes the measured resistance of each cable and component, such as the 400 A class T fuse, battery disconnect switch, shunt, 400 A mega fuse, and the Lynx Distributor busbar system. These resistances are assumed to be worst-case values as we rounded up measurements and the measurement device’s connection to each component was simply the tension applied by the spring-loaded probes. The total measured resistance of components and cables around our system’s critical path is 1.77 mΩ. With this resistance, we concluded that our system should be capable of providing just over 180 A while remaining at or below our 2.5% voltage drop goal.
Final System
After considerable cold winter work, our design came to fruition. As previously described, our power system fits within the left pass-through storage area, illustrated in Figure 3.
Figure 3 illustrates our complete power center providing 800 W of solar, 360 Ah of Lithium-ion batteries, and a 3kVA invert/charger.
Figure 3 illustrates the major components of our system. There are seven major components illustrated from upper left to lower right:
Solar PV disconnect switch
Victron SmartSolar 150/45 solar charger
Victron MultiPlus-II 2x 120V inverter/charger
Victron Cerbo GX monitoring system
Victron SmartShunt
Blue Sea battery switch
Victron Lynx Distributor
Our battery bank is behind and to the right of this location. The solar charger and the SmartShunt attach to the Cerbo GX via VE.Direct cables. The battery voltage monitor (mounted on the battery bank) and the MultiPlus-II connect to the Cerbo GX via two VE.Bus cables.
We used a Victron MK3-USB device to program the inverter/charger for our specific setup and then used the remote console provided by the Cerbo GX to monitor the initial startup. After turning on the battery switch and the solar PV switch, the system immediately started providing inverted power to the RV, and the solar charger started charging the batteries. Next, using a halogen light and my wife’s toaster, we applied some moderate load to the system and took some readings, found in Table 1.
Battery Voltage
Inverter Voltage
Voltage Drop
Current (A)
Resistance mΩ
12.88
12.84
0.04
25
1.6
12.71
12.61
0.10
73
1.4
12.28
12.04
0.24
157
1.5
As expected, as the system current increases, the voltage drop experienced by the inverter/charger increases. We divided the voltage drop by the associated system current to calculate the system resistance. Averaging these three values, we note that the system resistance is 1.5 mΩ which is 0.27 mΩ lower than the measured 1.77 mΩ.
The system experienced a 0.24 V voltage drop with a 157 A load. A voltage drop of 0.24 V is a percentage voltage drop of just 1.9%, well below our limit of 2.5%. With a resistance of only 1.5 mΩ, we should be able to load our system to nearly 215 A without exceeding our 2.5% goal. These 5-10 minute load tests resulted in almost no heat generation by the inverter/charger or any system components. I am looking forward to more extended tests to see how hot things get.
Summary: How Did We Do
Nearly three months ago, we outlined our goals for our new power center in our first post on this subject. We desired the ability to use our microwave, television, and other 120 V AC systems without having to ruin our camping solitude with a generator. In addition, we wanted to minimize the intrusion of our generator while recharging our batteries. We determined that to meet our needs, we needed several items:
400 Ah of lithium-ion batteries
800 Watts of solar power
An inverter that is capable of producing nearly 3000 Watts of 120 V AC power
A battery charger that is capable of consuming our entire generator output to minimize charge time
We have nearly met each of these requirements. Instead of 400 Ah of batteries, we have 360 Ah, and instead of 3000 W of inverter power, we have 3000 VA or 2400 W continuous. We believe each is close enough to call this project a success. Perhaps more importantly, we learned a lot on the journey and had a lot of fun. If our RV needs to be restored to what we had before this project, here is a brief description of the required tasks.
We did a couple of things right and a few we’d do differently with the new knowledge we possess:
We can’t properly express how great the copper bar approach to connecting the battery disconnect switch and the SmartShunt to the Victron Lynx Distributor is. Using a short segment of 4/0 wire and a lug at each end results in a rather long connection. The copper bar approach saves space, looks clean, and in our cramped environment made our layout possible. You could save ten bucks if you want to make your own, but we saved ourselves the cutting, drilling, and the likely mistakes and bought a pair.
I wouldn’t have initially skimped on our torque wrench purchase. Our fitst purchase had a torqu range of 10-100 ft-lbs and barely registered when being used at the low end. We ended up twisting a bolt head on a battery lug clean off. This was dangerous and could have resulted in a bolt being unretrievable from an expensive battery. Fortunately, just enough bolt was left to enable its removal with a pair of vicegrips. We love our second torque wrench, the Park Tool TW-6.2.
We would definitely use boat/marine wire instead of the 6/3 Romex that we installed. Our RV, like most, is full of Romex making us comfortable that this was a reasonable choice. In addition, 6/3 Romex contains stranded conductors, but not like ultra flexible boat/marine wire such as Ancor’s Triplex Cable.
We would have used lugs suggested by Victron Energy. The 4/0 sized lugs we used are great, but don’t fit very well within the Victron Lynx Distributor. I suspect, but have no evidence that the lugs they suggest would fit much better.
We’re done, it looks clean and neat, and above all else, it works!
This post is the eighth of an ongoing series of articles documenting and describing our RV electrical upgrade. Our previous post in this series described some non-power-related improvements to the pass-through storage area. These improvements included thermal insulation and an acquired storage system. In this post, we describe a simplified model of our battery bank, the wiring of our system, the resistance contributed by each component and associated cables, and the expected system voltage drop. Our goal is to keep our voltage drop to 2.5% or less as recommended in Victron’s Wiring Unlimited.
Our Battery Bank
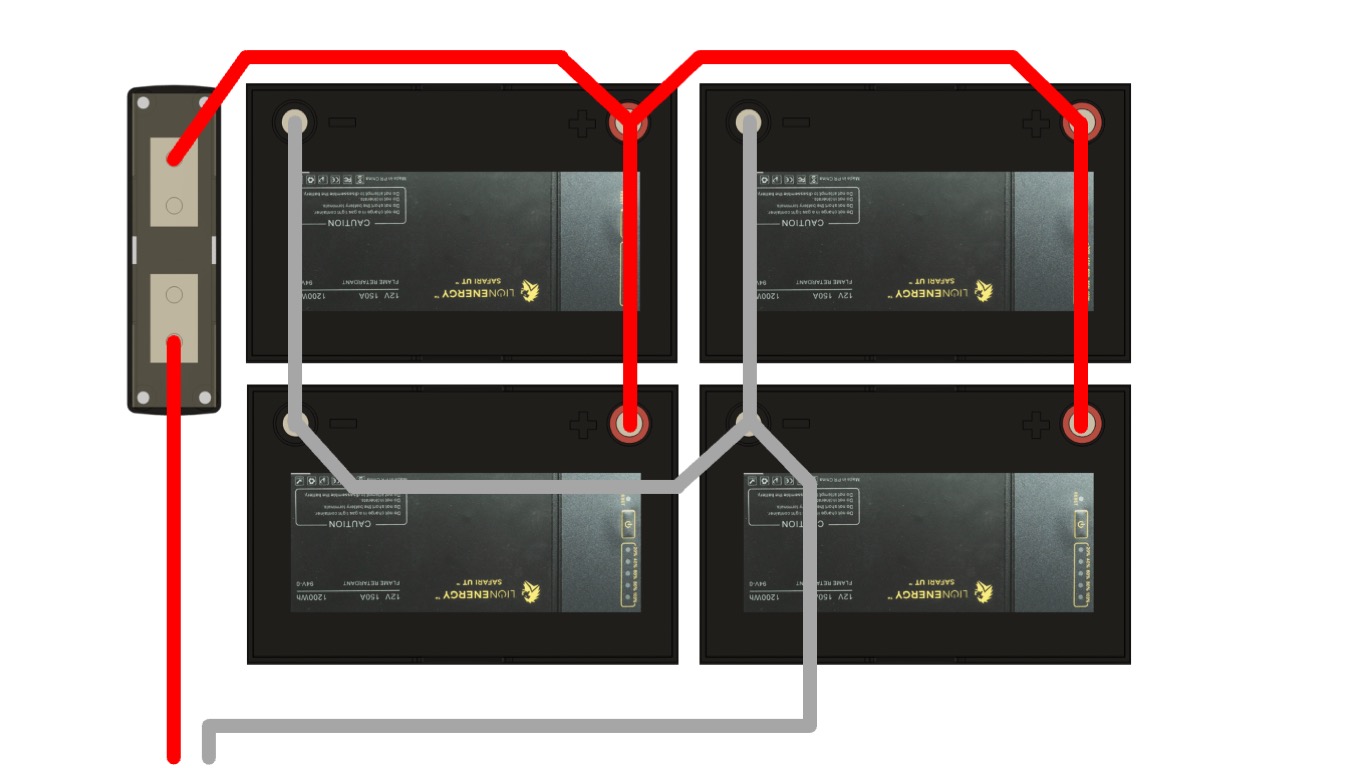
Figure 1 illustrates the Halfway parallel battery configuration.
We previously discussed the idea of installing a 24 V system to reduce system currents, but we have determined to stay with a 12 V system. A 12 V system keeps things straightforward and reduces our time to completion. We’ll use the “Halfway” parallel configuration for our battery bank as described in Wiring Unlimited and illustrated in Figure 1. We chose this approach because it simplifies the cable layout given the physical placement of our batteries.
The Halfway configuration ensures the circuit path from each battery’s positive terminal, through an otherwise balanced load, and back to the same battery’s negative terminal is the same length for each battery. Strictly speaking, the resistance, measured in ohms (Ω), should be kept equivalent and minimal, but length is correlated to resistance and is easier to measure. Our design will opt for wiring convenience over strict adherence to keeping each path equal in length. Using wires of various lengths will introduce minor deviations from the ideal.
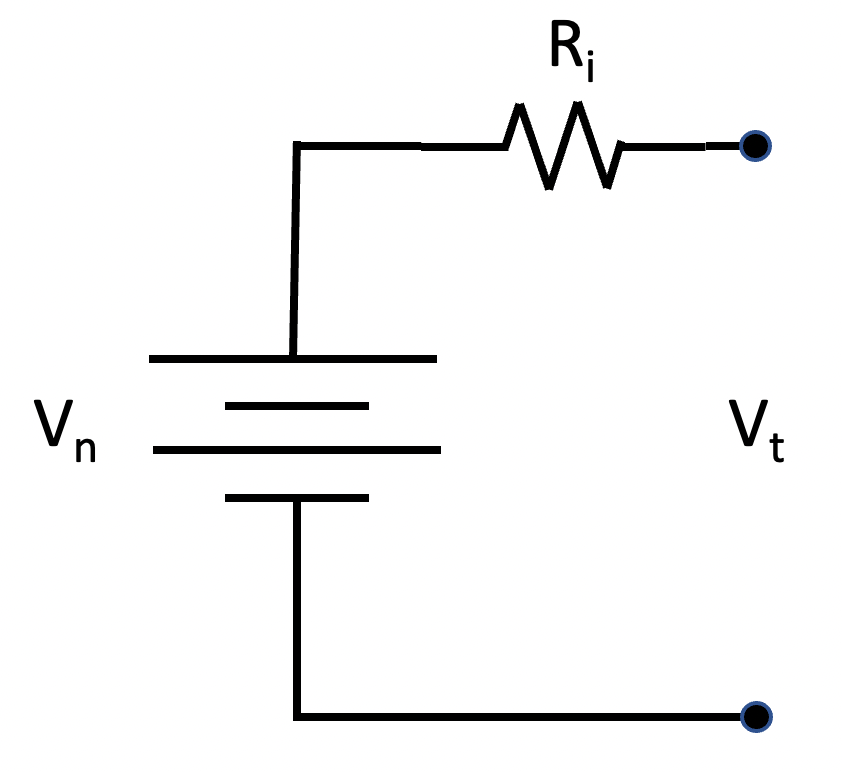
Figure 2 illustrates a simple battery model consisting of an ideal/imaginary battery and a resistor representing the internal resistance of a real-world battery.
We developed a simplified model of our battery bank to determine if our design is viable. As the load on a battery increases, the voltage measured at the terminals decreases due to internal battery resistance. The battery model illustrated in Figure 2 includes an ideal battery and a resistor representing the battery’s internal resistance. Vn represents the battery’s nominal voltage, Ri represents the battery’s internal resistance in ohms, and Vt represents the voltage measured between the battery’s terminals. This model predicts that as the current draw from the battery increases, the voltage seen at the terminals will be lower than the nominal voltage; Vt = Vn – Ri*i, where i is the current drawn from the battery measured in amperes.
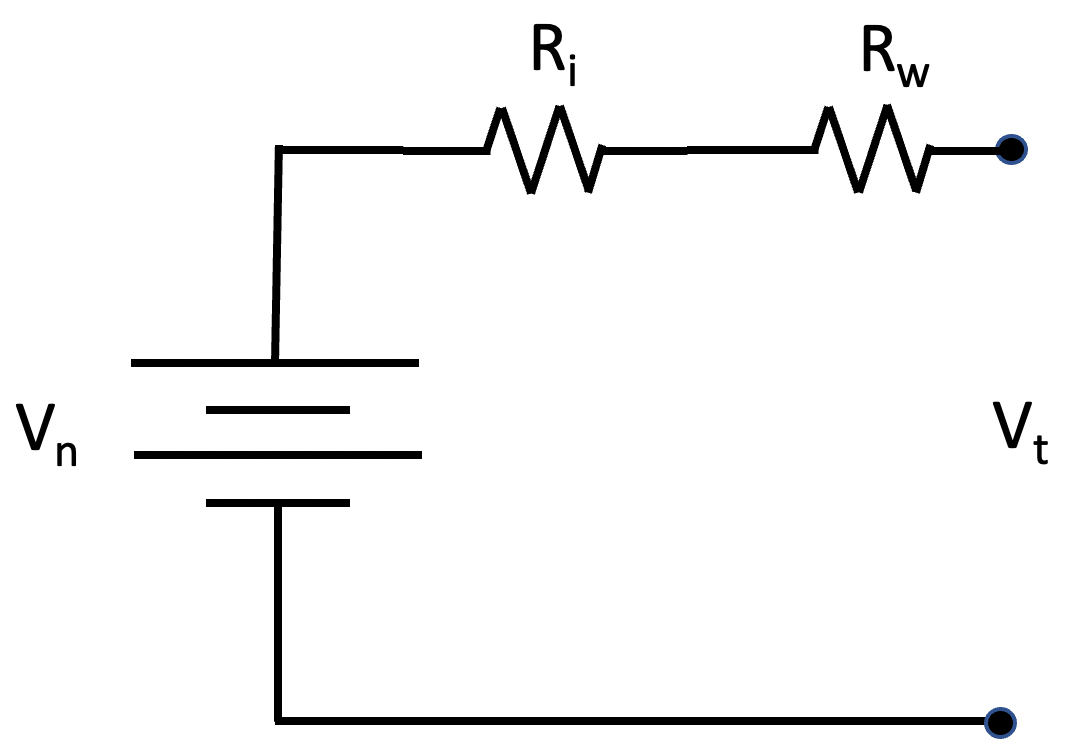
Figure 3 illustrates the addition of wire resistance to the model of Figure 2.
Our battery bank consists of four batteries interconnected with cables. These cables add additional resistance, Rw, to the system, as illustrated in Figure 3. Four of these models, each with a potentially different value for Rw, connected in parallel represent our battery bank.
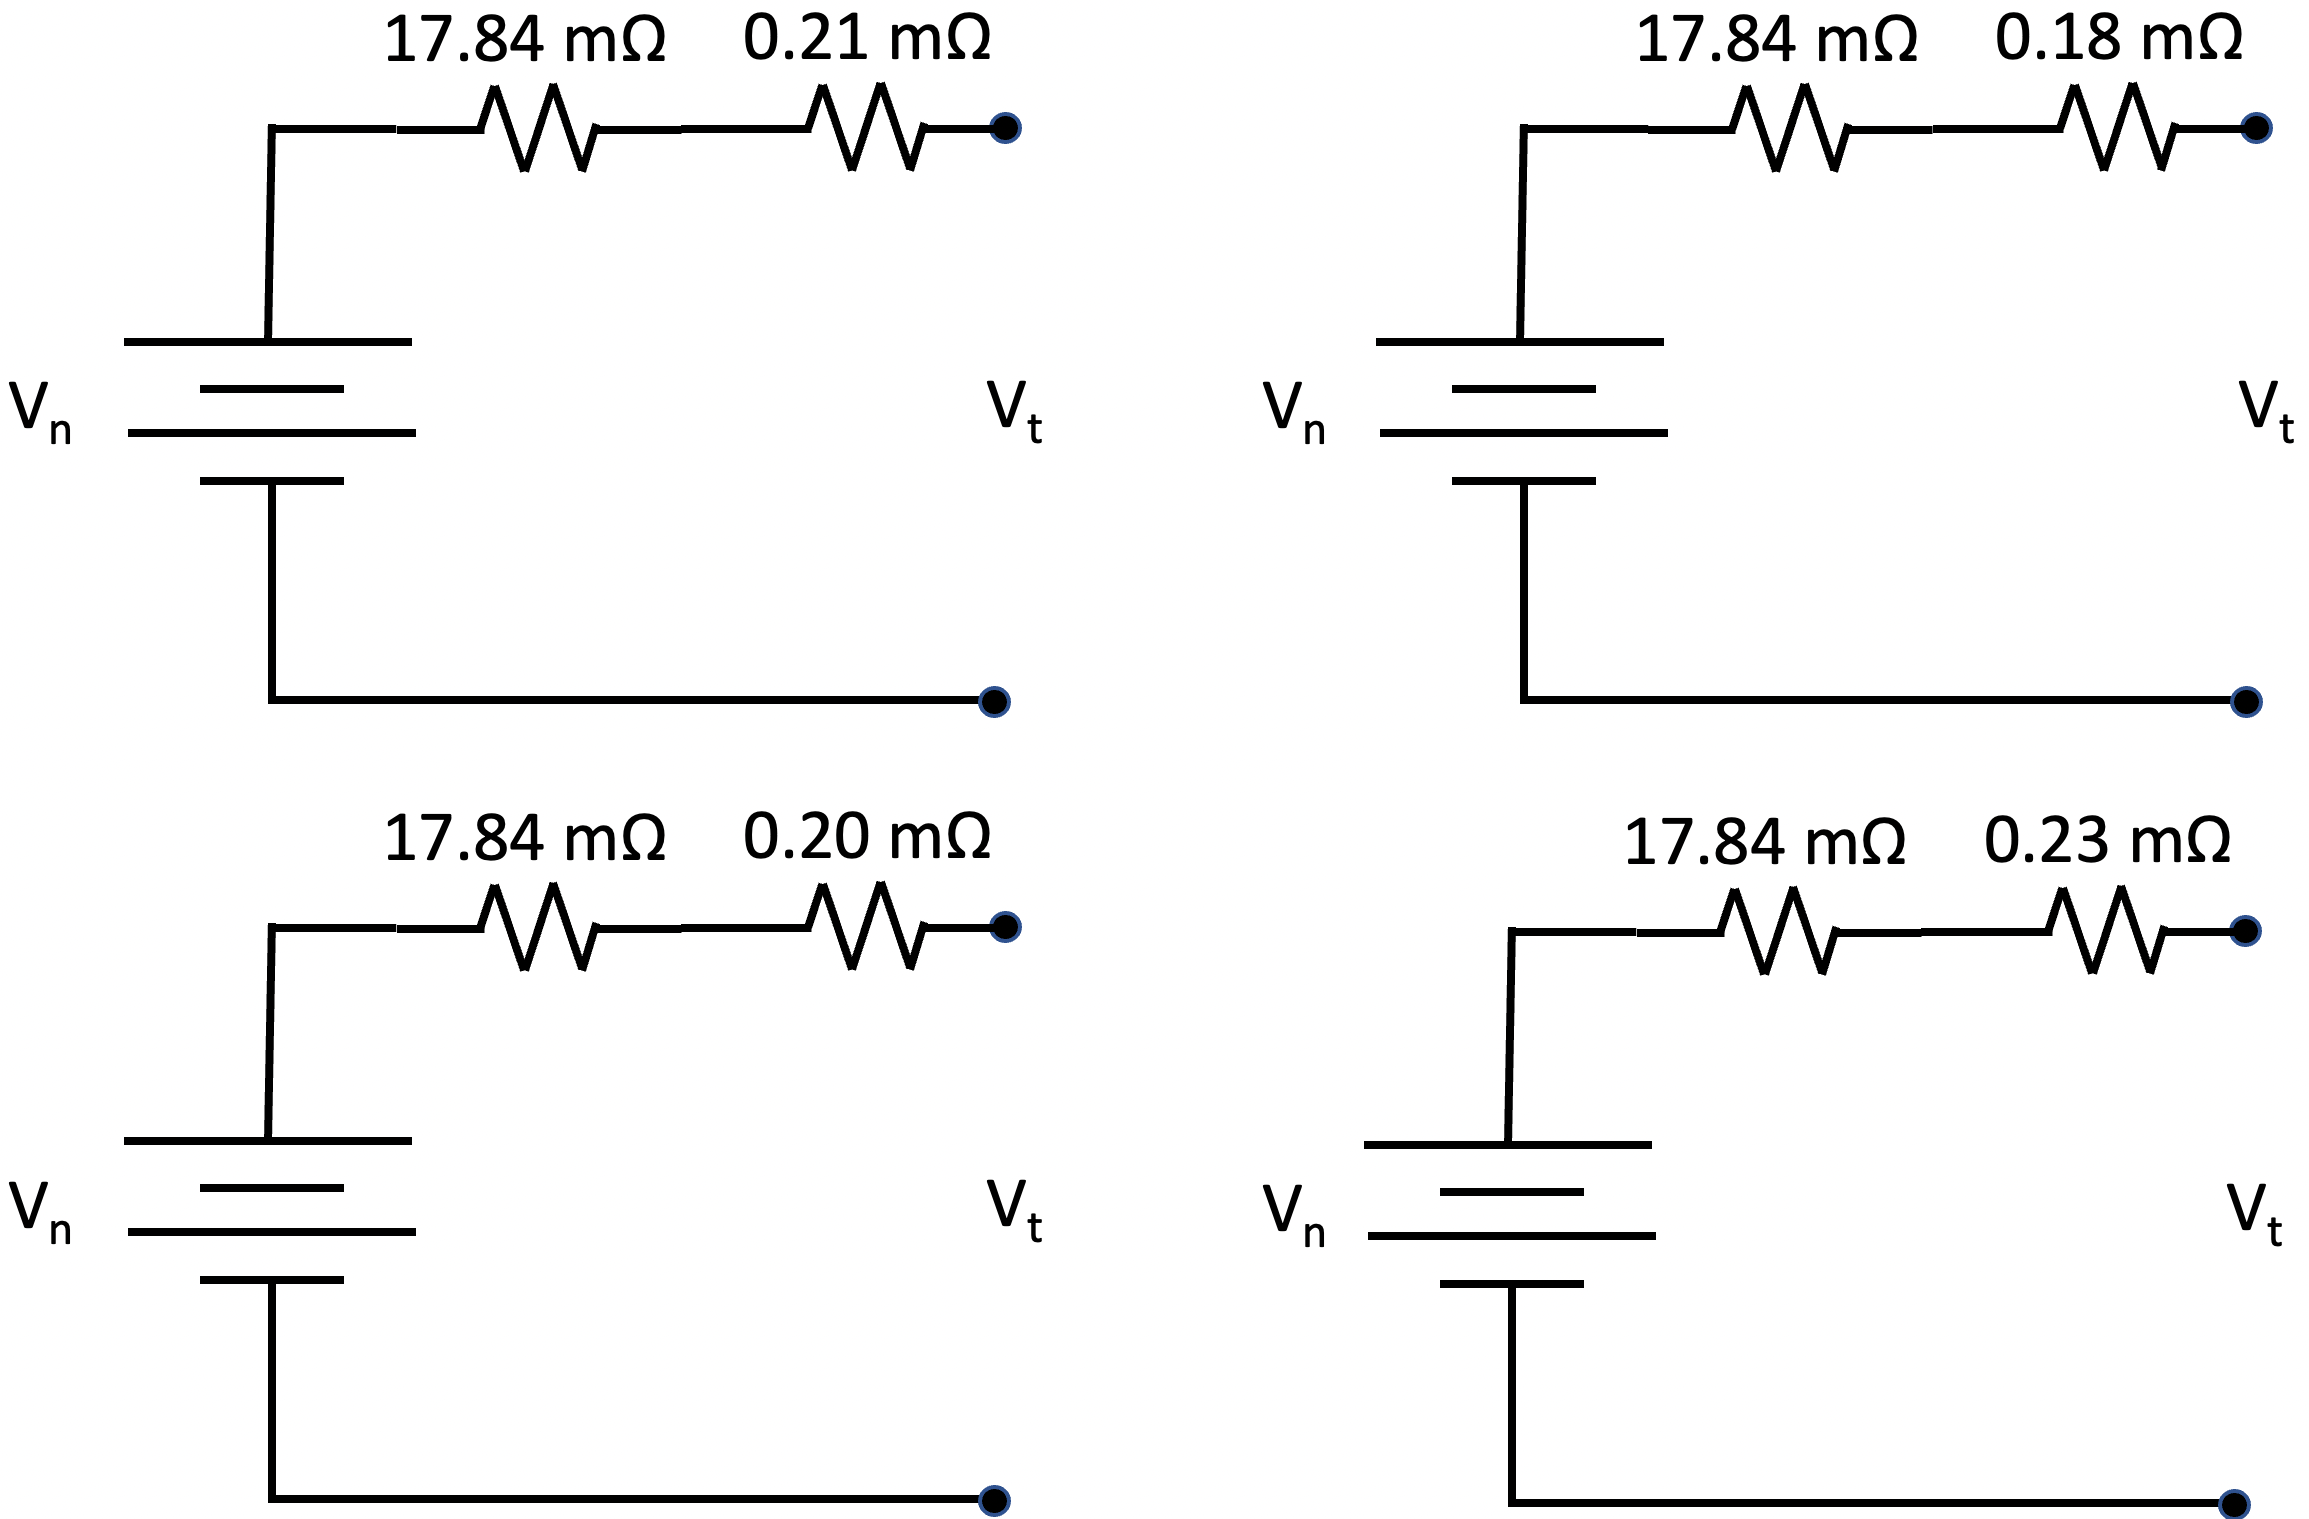
Now let’s put some numbers to these models and see what we expect from our battery bank. Lion Energy reports that the internal resistance of their UT 1200 battery is 17.84 mΩ. Using a Keithly 2450 SourceMeter, we measured the resistance of each 4/0 cable we created. We crimped lugs to both ends of each cable and measured each cable’s resistance from the center hole of one lug to the center hole of the other. There are two 11″ cables measuring at 0.10 mΩ for the red cable and 0.13 mΩ for the black cable. There are four 6.5″ cables measuring at 0.08 mΩ for the two red cables and 0.10 mΩ for each of the two black cables. Figure 4 illustrates the simplified models of our four batteries using the Lion Energy reported battery internal resistance and the measured values of the 4/0 wires interconnecting our batteries.
Figure 4 illustrates a model for each of our four batteries. Each battery has the same internal resistance, but the wiring making up the battery bank gives each battery a slightly different value for Rw.
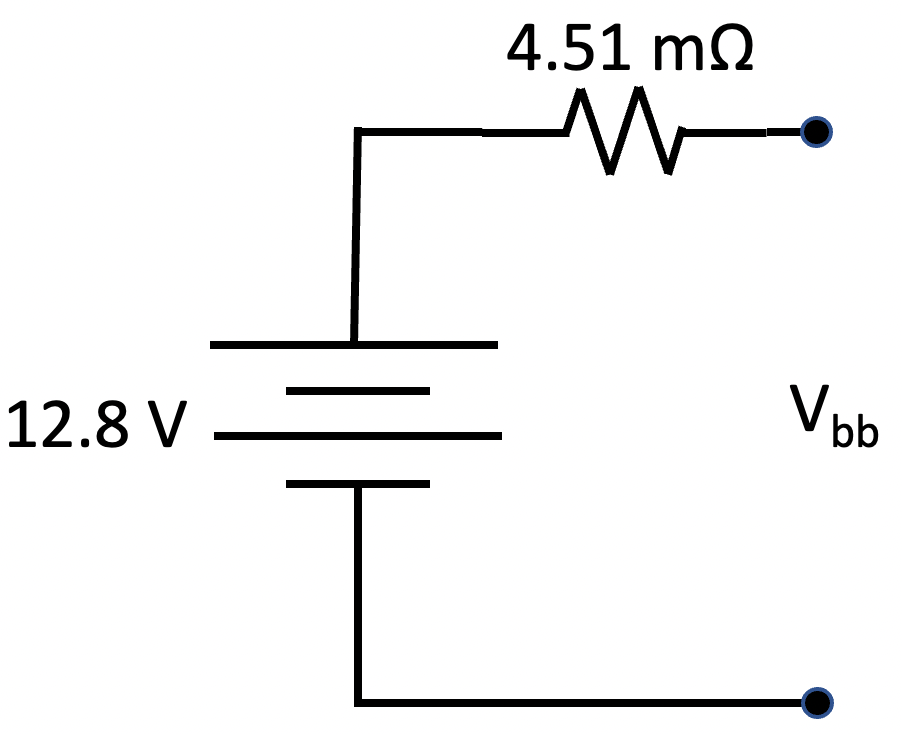
Figure 5 illustrates our simplified battery bank model.
After connecting the four models illustrated in Figure 4 in parallel, circuit analysis and simplification results in the model shown in Figure 5. In this model, the resistance of the entire battery bank is 4.51 mΩ, with the nominal voltage being 12.8 V. Vbb represents the voltage seen across the two battery bank terminals that connect to the remainder of our power system.
Note that the interconnect resistance is relatively small compared to the internal resistance of each battery. If the wiring resistance were zero, the model for the battery bank would be trivial to acquire. The battery voltage would have the value Vn, and the series resistor would be the internal resistance of a single battery divided by the number of batteries. With an internal resistance of 17.84 mΩ, the ideal series resistor would have a value of 4.46 mΩ. Note that our model’s resistor has a value of 4.51 mΩ, just a bit more than the ideal. We could see currents approaching 275 A in our system. At 275 A, our model predicts that Vbb would be 1.24 V lower than Vn, or 11.56 V, while the ideal model predicts a Vbb of 11.57 V, not a significant difference. We expect typical maximum currents of 150 A. At this level, we expect Vbb to be 0.68 V lower than Vn, or 12.12 V.
Our Power System
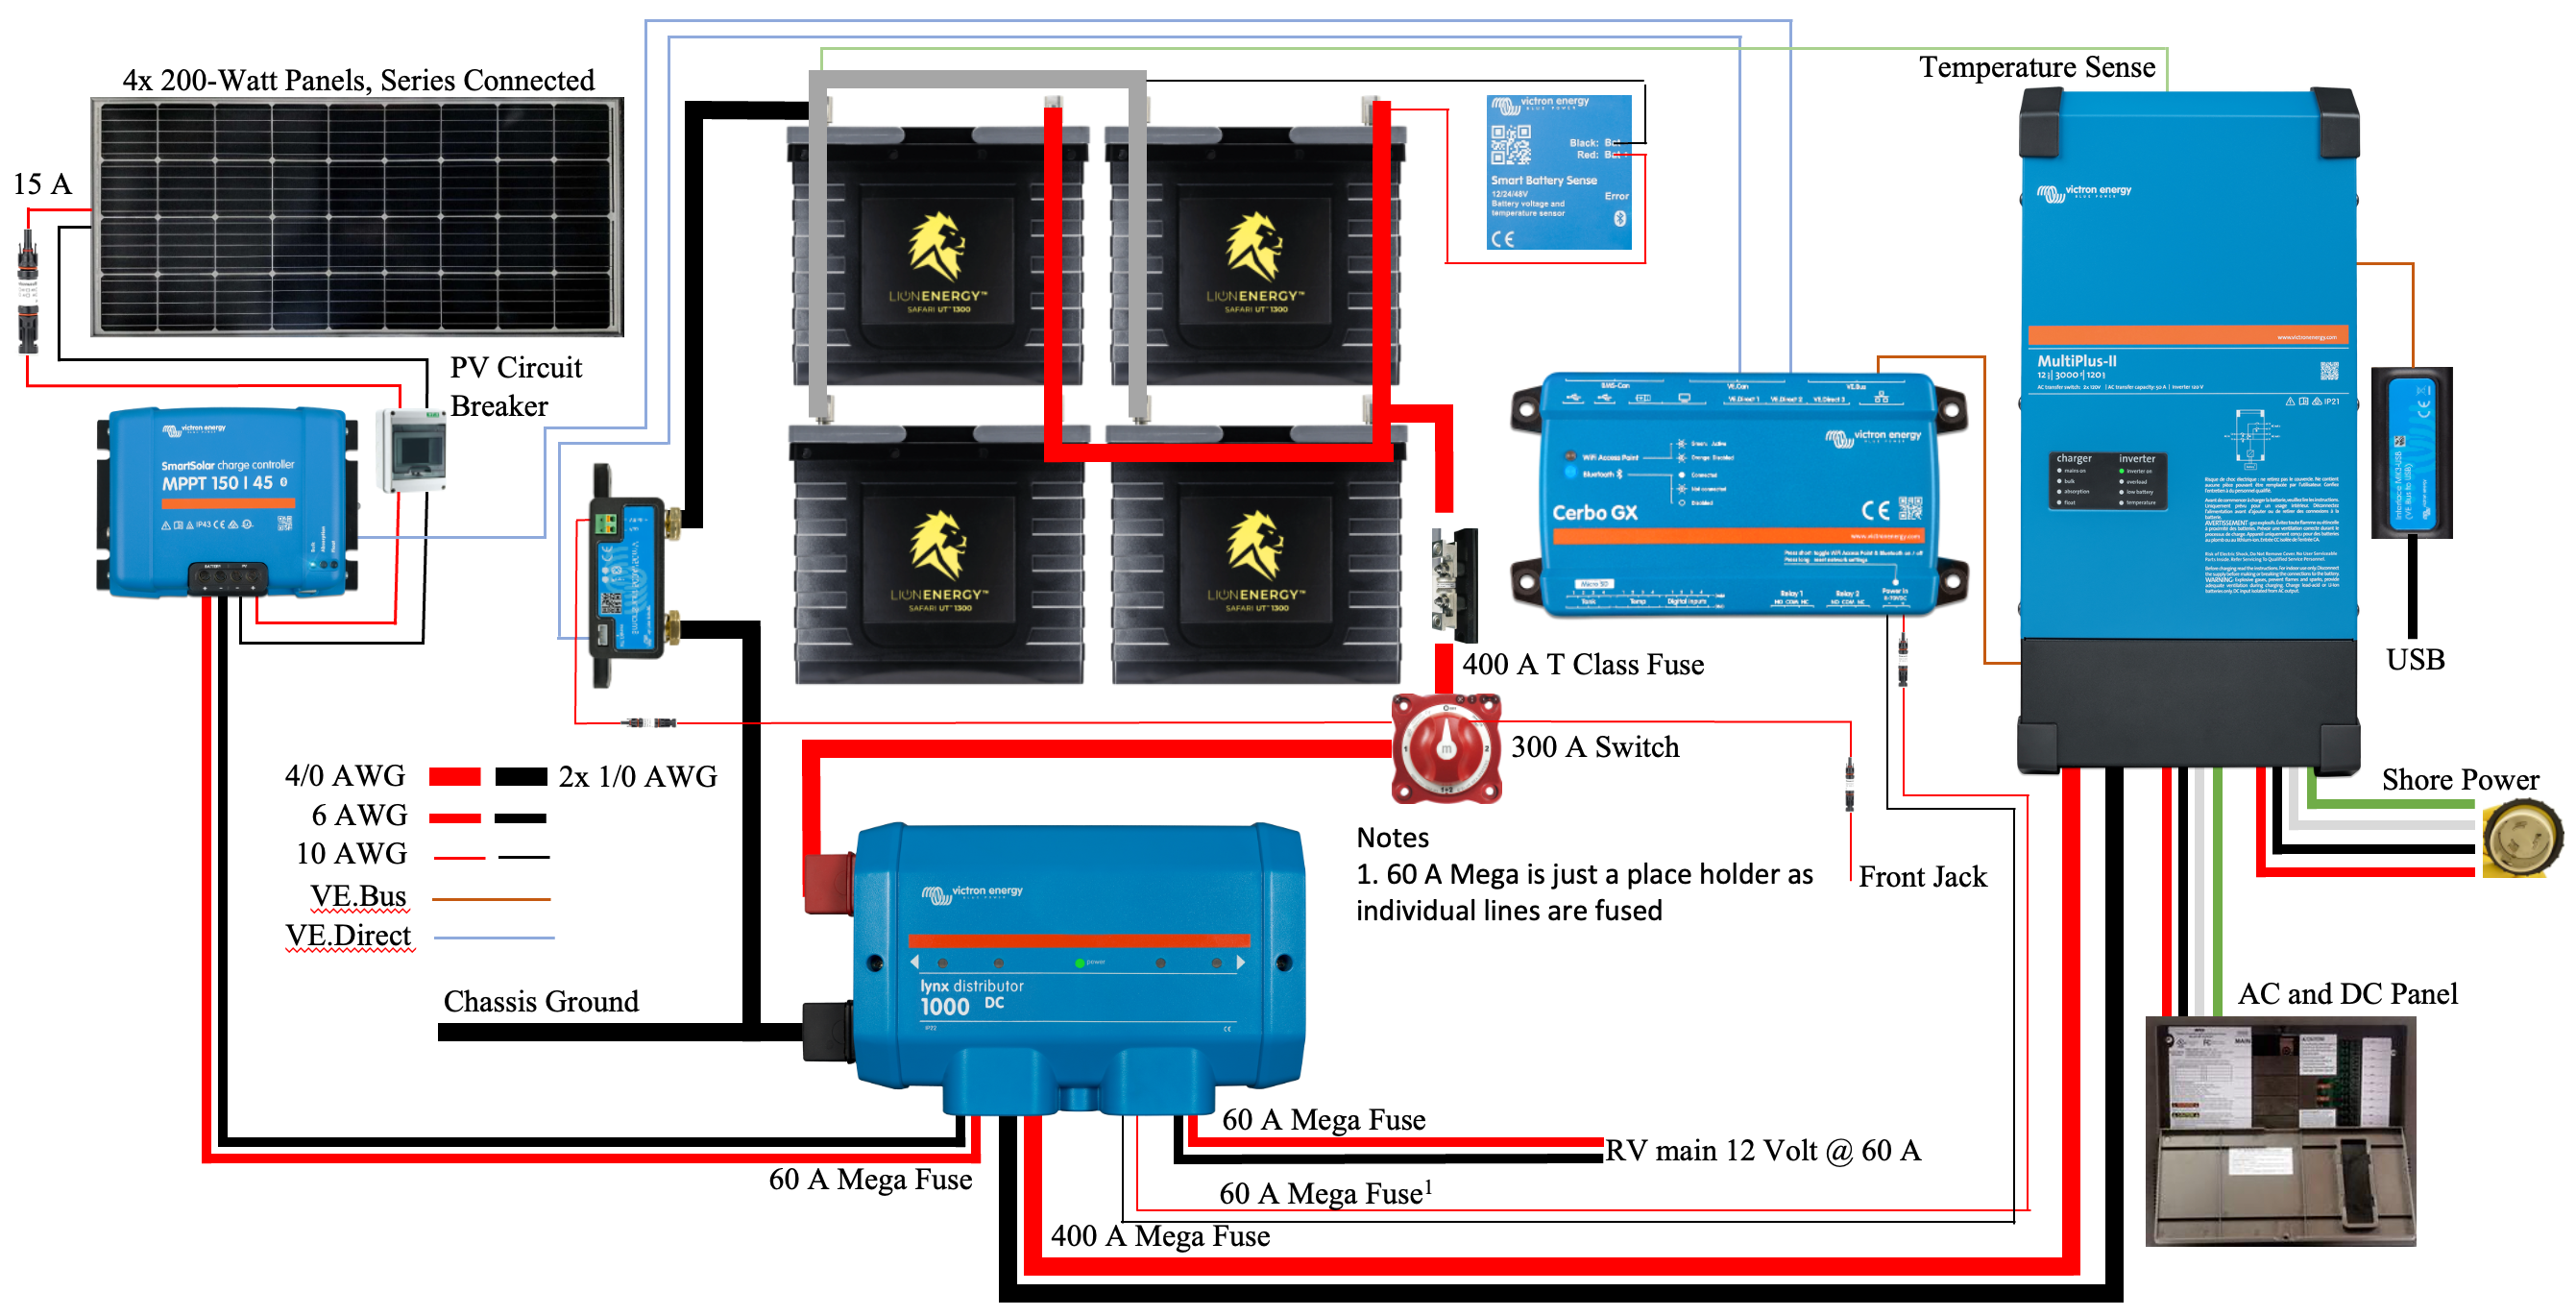
Figure 6 illustrates our entire power system.
The power system we are endeavoring to build is described in a previous post and illustrated in Figure 6. The critical path in our system is the circuit from the battery bank to the inverter/charger and back. The other system components are essential but generate or consume far less power than the inverter/charger, resulting in lower currents and associated voltage drops.
Figure 7 illustrates the components and cables that make up our system’s critical path and associated resistance values.
Figure 7 illustrates a simplified schematic of our system, including only the components and 4/0 cables involved in the high current critical path. These 4/0 cables should be capable of carrying 400 A of current. The figure also includes the resistance of each cable and components such as the 400 A class T fuse, battery disconnect switch, shunt, 400 A mega fuse, and the Lynx Distributor busbar system. The cable resistances were measured using the method previously described. Component resistances were obtained by properly torquing a cable of known resistance to each component connection, measuring the resistance from the end of one cable to the end of the other cable, and subtracting the resistance values of the two cables.
In this simplified schematic, we have replaced the battery bank with an image of a single battery with the voltage and resistance values computed using our battery bank model. All resistance values are included in Table 1.
Component
mΩ
13" 4/0 red cable with lugs crimped to each end. Connects battery bank to fuse holder.
58" 4/0 black cable with lugs crimped to each end. Connects SmartShunt to battery bank.
0.35
Total circuit resistance from battery bank
1.77
While not critical to this work, it is interesting to note that according to this table, a 1000′ segment of room temperature 4/0 copper wire has a resistance of 50 mΩ. This implies that our 13″ cable connecting our battery bank to the rest of our system should have a resistance of 0.054 mΩ, yet it measures in at 0.10 mΩ. The crimped lugs contribute the difference of 0.046 mΩ. This implies that each 4/0 crimped lug contributes 0.023 mΩ of resistance. Another interesting fact is that our black 4/0 wires used in our battery bank wiring have a slightly higher resistance than their red equivalents. For example, the black 6.5″ cables have a resistance of 0.10 mΩ while the equivalent red cables have a resistance of 0.08 mΩ.
The total resistance of components and cables around our system’s critical path is 1.77 mΩ. With the inverter powering its maximum load of 3 kVA and just before system shutdown with a battery voltage of 11 V, the system currents would be approximately 273 A. Our system resistance at these high currents would result in a voltage drop of 0.48 V. However, no single system in our RV consumes this much power, and two or more of the large systems would exceed the maximum limit. We expect currents in the 150 A range when either our air conditioner or our microwave oven are operating. At 150 A, our voltage drop will be 0.27 V or 2%, a reasonable figure. Our system should be capable of providing just over 180 A while remaining at or below our 2.5% voltage drop goal.
Summary
Our goal is to create an RV power system that meets our design objectives. One of our goals is to satisfy our power needs while suffering less than a 2.5% voltage drop due to system resistance. This goal will reduce the likelihood of excessive system ripple and other undesirable characteristics. Our system has a critical path resistance of 1.77 mΩ and should supply up to 180 A while staying below a 2.5% voltage drop; this should meet our needs and validate our design’s viability. Next up is the remainder of the implementation.
This post is the sixth of an ongoing series of articles documenting and describing our RV electrical upgrade. Our previous post in this series described the Victron Energy Lynx Distributor and a minor modification we made to it to meet our needs better. This post describes the original shore power wiring and our improvements. In addition, we discuss a severe flaw that was difficult to find.
Shore Power
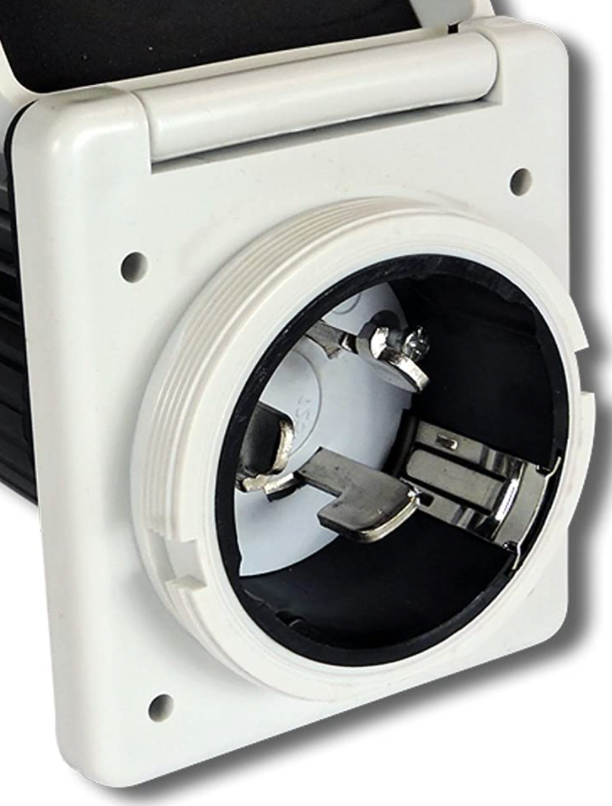
Figure 1 illustrates a typical 50 A shore power connector.
Figure 1 illustrates a typical 50 A RV shore power connector. A power cord may connect this outlet to a shore power pedestal that provides 50 A AC power to run appliances such as air conditioners, microwaves, televisions, and power converters for charging batteries. In addition, a 50 A connector can be adapted to a 30 A or 15 A power source using appropriate converters or dogbones. Alternatively, this connector may be connected to a generator when shore power is unavailable.
The connector illustrated in Figure 1 connects to the RV circuit breaker panel via appropriate conductors inside the RV. For example, our Outdoor RV 240 RKSB has 6/3 Romex that connects the shore power outlet to the main breaker in the circuit breaker panel, as illustrated in Figure 2.
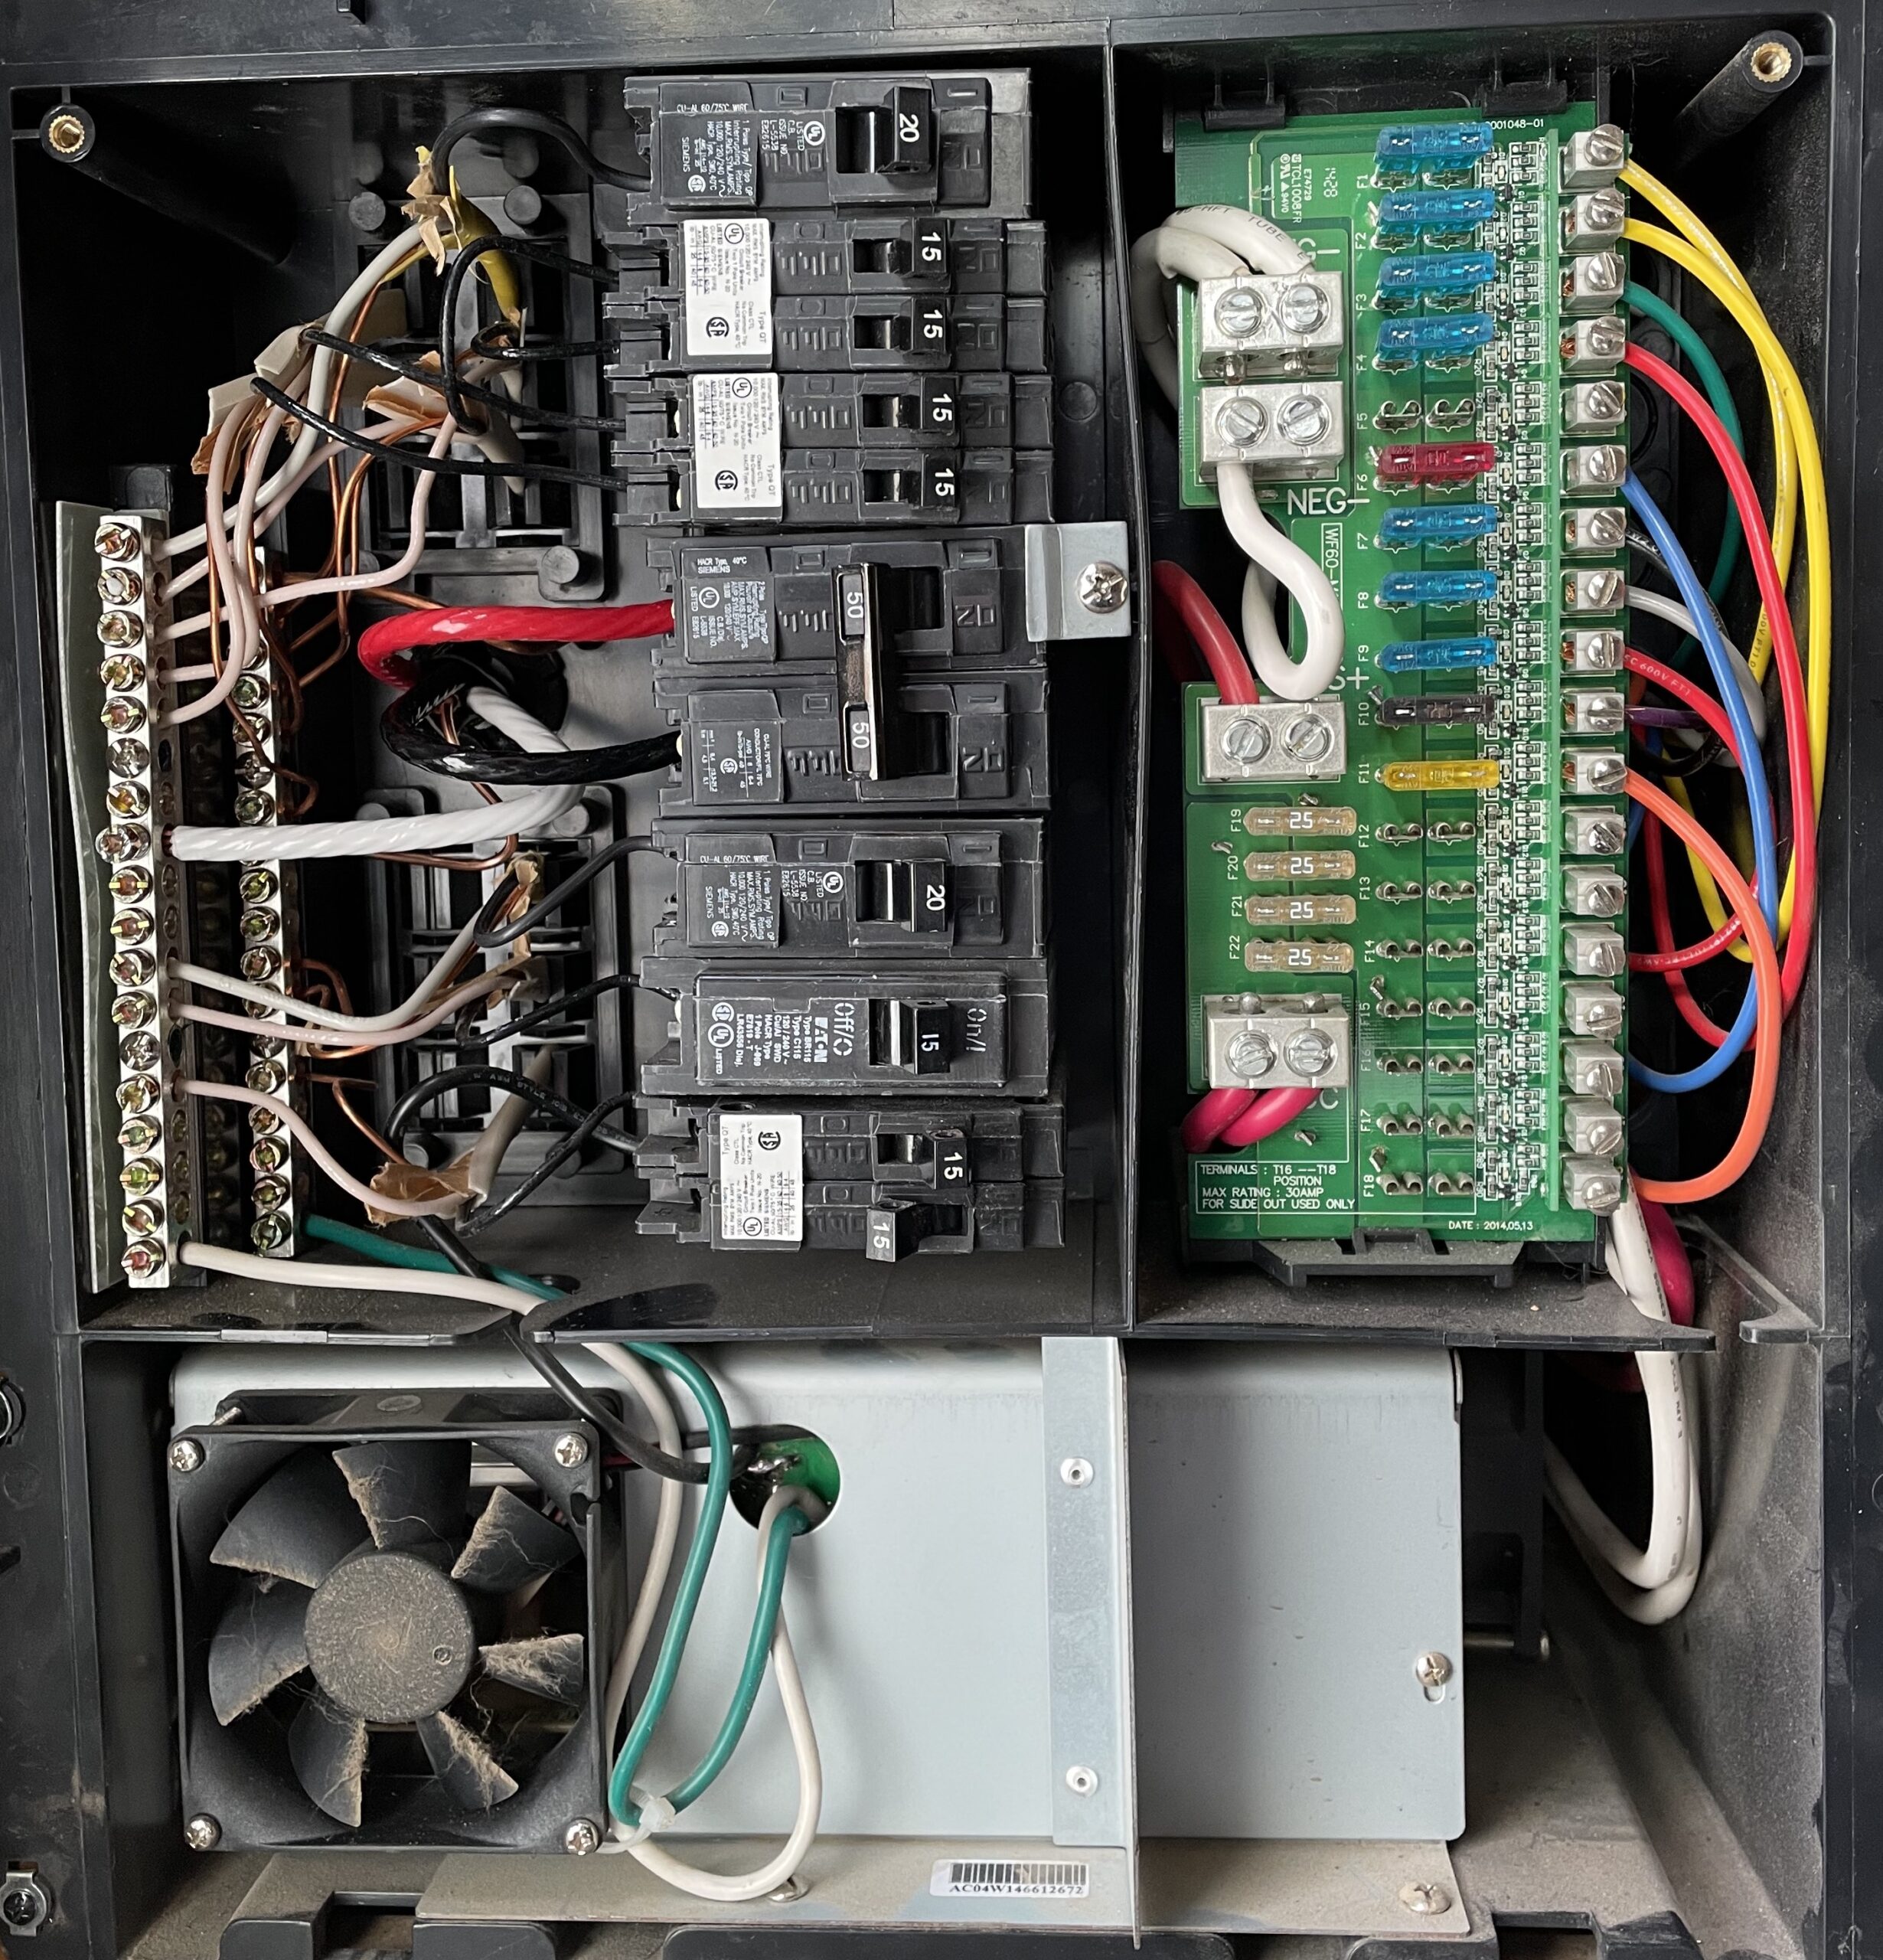
Figure 2 depicts a typical RV circuit breaker panel with a 50 A service.
6/3 Romex has three 6 AWG conductors and one 10 AWG bare copper wire. The 6 AWG red and black wires are connected to the 50 A breaker. The white wire is the associated neutral wire connected to the neutral busbar. The bare copper wire is attached directly to the ground busbar.
The left side of the circuit breaker panel distributes 120 V AC to various trailer components, including 120 V AC outlets, television, microwave, air conditioner, and the power converter located beneath the circuit breaker panel, as illustrated in Figure 2. The power converter converts 120 V AC into the appropriate DC voltages to charge our 12 V RV batteries.
The right side of the circuit breaker panel acquires power from the 12 V RV batteries and distributes this through blade fuses to various RV components such as lights, pull-outs, pumps, USB ports, audio systems, etc. In addition, the power converter output connects to the batteries via this side of the panel for charging.
Inverter/Charger Power
The ability to use all of our 120 V appliances without needing shore power or a generator is the primary objective of this project. Including an inverter/charger in our power center will accomplish this goal. The desired inverter charger will pass through shore or generator power when available and provide 120 V power when they are not. The inverter/charger requires shore power as an input, and its 120 V AC output must be connected to the circuit breaker panel to enable this feature.
We desired to leave the shore power outlet in its original location, requiring us to run 6/3 Romex from the shore power connector to our new power center and another strand of 6/3 Romex from our power center to the circuit breaker panel. Rather than running these two strands to two different locations, we determined to run both from our power center to just behind the circuit breaker panel.
Rather than fussing with the RV underlayment, routing the cables around tanks, and through the frame, we hired this out to Stewart’s RV, our local RV service center. We purchased 125 feet of cable and delivered it to the service folks at Stewart’s, who did an excellent job in all but one aspect. We’ll address the one flaw in the next section.
Figure 3 illustrates conductors of 6/3 Romex spliced using two-conductor Morris connectors.
Once the wiring was in place, we made the right connections. First, we detached the original shore power connection from the circuit breaker panel and spliced it to one of the new 6/3 Romex strands using four two-conductor Morris connectors. These connections are illustrated in Figure 3. Next, we combined the two strands of 6/3 Romex in our power center using four additional Morris connectors. Finally, we joined the remaining conductors to the circuit breaker panel. With these modifications, shore or generator power comes in through the shore power connection, over the original 6/3 wire, through a new strand of 6/3 Romex to our power center, back through the second strand of 6/3 Romex, arriving at the circuit breaker panel. The before and after connections are identical, but the path has increased by roughly 50 feet.
The spliced 6/3 Romex cables in our power center will be separated when our inverter/charger is installed. The 6/3 cable coming from the shore power connector will be tied to the inverter/charger’s input. The remaining cable will be connected to the inverter/charger’s 120 V AC output.
Testing, Debugging, Repairing
Before connecting shore or generator power to our RV, I tested for short circuits within the circuit breaker panel. Unfortunately, I found a low resistance short circuit between the ground and neutral busbar. As a sub-panel, this should not be the case. I looked for obvious wiring flaws but didn’t find any. I returned our trailer to the service center, reporting a short circuit between ground and neutral.
They made a thorough inspection of their work and found no flaws. They did what I should have done after installing the wires and before wiring things together. They tested the continuity between each possible conductor pair of both strands and found no short circuits. I accepted their findings and began a tedious search for the truth. I completely rewired the circuit breaker panel and eventually convinced myself that perhaps it was a strange interaction with the power converter, etc.
I determined to plug the trailer in and see what happens. I knew it wouldn’t be a disaster, but I wanted to see if it would work. Unfortunately, immediately after plugging in the trailer, the GFCI outlet tripped. After much more work, I determined to plug it into a non GFCI protected outlet, and the trailer worked great. I carefully measured the potential between the trailer frame and ground to ensure my safety; everything was fine, well, it seemed fine.
GFCI outlets trip because the current on the hot wires differs from that of the neutral wire by more than 5 mA. In other words, GFCI trips when current is flowing through some undesirable path, like through you. So why was this happening? A considerable amount of literature describes GFCI failures due to long runs, over 100 feet, for example. Essentially, the longer the wire, the more leakage between conductors, and when this exceeds 5 mA, the GFCI trips. Therefore, the longer the wire, the more likely this is. While I had successfully used the failing shore power connection previously, I also recognized that I recently added nearly 50′ to the circuit through my new wiring. Perhaps this was the culprit. I moved the trailer much closer to the outlet and removed more than 50′ of cords, and it still failed.
After disconnecting the cable from the circuit breaker panel and removing the Morris connectors, I rechecked each conductor to ensure independence. Still no short circuits detected. Finally, in a last-ditch effort to find the flaw, I checked each wire in each cable for connectivity to the trailer’s frame. I found the elusive, obvious, and now embarrassing culprit. When the service center installed one of the new cables, its neutral wire was inadvertently electrically connected to the trailer’s frame.
The circuit fails as follows. The ground busbar in the circuit breaker panel is appropriately attached to the trailer’s frame. However, when the faulty neutral wire is connected to the neutral busbar, the trailer’s frame connects the neutral and ground busbars, which is inappropriate for a subpanel.
The test for this condition is simple and easily recreated. I returned the trailer to Stewart’s RV, demonstrated the test described above to them, and they accepted responsibility for the issue. They removed each cable clamp assembly installed, inspected for damage, and repaired where the wire insulation was cut and shorted the neutral wire to the frame. They demonstrated great integrity and excellent service through this ordeal and were consistently friendly and polite. They will get all of my future business.
Summary
Our new AC wiring is in place and works perfectly. One of our goals was to end each sub-project with our trailer in order and available for camping. With this project done and working, we’ve reached that goal. Several takeaways:
Morris connectors are amazingly awesome and much easier to work with than junction boxes.
Vendors, such as Stwart’s RV, with integrity are a pleasure to work with even when things seem tough.
Most importantly, check continuity between each conductor and between each conductor and the trailer’s frame! This one simple test would have saved dozens of hours of searching, poking, disconnecting, etc.
This project was our least understood because of the difficulty and uncertainty of physically dragging cable from the very front to the very back of our RV. However, the rest should be easy with this step done and working. Did I say that out loud?