UVU’s Secret Sauce

In a recent opinion piece in the Deseret News, Samuel Benson writes that Utah Valley University (UVU) is leading higher ed’s tech revolution. He raises several key points:

  1. Many universities cut back or closed permanently during the pandemic. UVU, instead, graduated its largest class in its history — 6,410 students — last fall.
  2. Much of the credit goes to Dr. Astrid Tuminez, who now enters her third year as the university’s president. She’s the perfect person for the job — a veteran in the tech sector.
  3. Even before the pandemic disrupted in-person learning, she made sure UVU was prepared.
  4. UVU wants technology to drive and enhance every aspect of the student experience, from recruitment to graduation.
  5. The technological revolution is alive and well in the shadow of Silicon Slopes, and that will continue long after masks and social distancing are relics of the past.

In response to Mr. Benson’s article, several individuals asked the question, what is UVU actually doing that is different from other institutions? What is UVU’s secret sauce? Well, that is a question worth answering. It isn’t as much about what we are doing as who we are. The remainder of this post will address who we are, the culture of UVU, and what we’ve done and will be doing.

Higher Education

In Clayton M. Christensen’s book, The Innovator’s Dilemma, he discusses how established industries must change to stay competitive. If they are unwilling or unable to change, they are doomed to eventual failure. We’re all familiar with GAFA or Google (1998), Amazon (1994), Facebook (2004), and Apple (1976). I’m old enough to remember alternative search engines, bookstores, mySpace, and computer companies such as Digital Equipment Corp., Compaq, and IBM. While some of these still exist, they have become less prominent in the fields dominated by the big four. What happened? Innovators, who founded the big four, disrupted the existing market space, and the previous big players weren’t able to or chose not to compete. By the time they realized there was danger of losing their markets, it was far too late.

According to Britannica, the first true university in the West was founded at Bologna late in the 11th century. Interestingly, Britannica, a company older than the United States, but only 1/4 the modern university’s age, who up until 2012 sold a 32 volume encyclopedia set for $1400, had to adapt to a new market. Britannica stopped printing its collection it had printed every other year since 1768 and now offers annual online subscriptions for $70.

Like Britannica and many other companies in many industries, higher education must adapt to changing needs and demands. If higher education institutions are unwilling or unable to change, they run the risk of becoming irrelevant. Our students will demand and deserve that we offer education in a form that they can and want to consume. They will demand that their education leads to the acquisition of good-paying jobs. Employers want access to students and graduates with the hard and soft skills they need to be competitive. Finally, society demands higher education provide all of the above without sacrificing the education the students need to become productive and civil members of our world community.

History, Clayton Christensen, and GAFA teach us that if we in higher education are unable or unwilling to adapt, we will be replaced by innovators who take the initiative to deliver a more modern education. We see some of this already happening with Grow with Google, Microsoft Learn, Great Learning, HackBright Academy, DevMountain, Western Governors University Academy, BYU Pathway Worldwide, and many others. So, how do we adapt to changing needs and wants while maintaining our identity as a university? Part of the solution is taking advantage of information technology and applying it where and when it increases student success, learning, and completion rates and decreases time to completion and cost.

UVU’s Secret Sauce

While nearly every higher education institution is putting classes online, training faculty to work remotely, and strengthening IT infrastructure, UVU is truly transforming the educational landscape. This starts with the exceptional can-do culture developed over the years by our students, faculty, and staff. Our students are diverse, inclusive, and gritty, our faculty put student success above their own professional aspirations, our amazing staff proactively reach out to students to help them be successful, our administration focuses on student success, and our president, Dr. Astrid Tuminez, resonates with our students, understands what an education can do for them, and understands how and where technology can help.

Digital Transformation

Digital transformation is about transforming the way an institution does business. In our case, it is about making education better, more accessible, with fewer administrative burdens for students and faculty. Digital transformation is about using technology in the right way, in the right places, and at the right times to help students complete their educational dreams and be successful.

To do this, digital transformation efforts must be aligned with institutional goals and strategy. UVU has an exceptional strategy document entitled Vision 2030. Vision 2030 includes the UVU Mission Statement that reads, “Utah Valley University is an integrated university and community college that educates every student for success in work and life through excellence in engaged teaching, services, and scholarship.” Vision 2030 outlines three strategies:

  1. Enhance student success and accelerate completion of meaningful credentials
  2. Improve accessibility, flexibility, and affordability for all current and future UVU students
  3. Strengthen partnerships for community, workforce, and economic development

Strategy Map

To ensure our digital transformation efforts are aligned with institutional strategy, we created, with assistance from PM2 Consulting, a strategy map, which is a diagram that shows an organization’s strategy on a single page.

At the top and center of a strategy map, we place the organization’s mission or vision statement. Stacked down the map’s left side are four perspectives: customers or stakeholders, internal processes, enablers, and financial.

Within each perspective, we place a small number of strategic objectives. Arrows indicate how one or more strategic objectives help accomplish others. Our strategy map is illustrated in Figure 1. For details regarding the creation of our strategy map, see my post, Digital Transformation Strategy.

Figure 1: Strategy map for the UVU Division of Digital Transformation, including strategic objectives and associated weights.

The UVU Division of Digital Transformation pursues the institutional strategies of achieving student success, including all students, and engaging our partners. We accomplish this by delivering delightful experiences, providing transformative solutions, strengthening our partnerships, and practicing exceptional product portfolio management. These strategies are supported by a culture of being responsive, manifesting UVU values, and developing our staff.

Where the Rubber Meets the Road

As much as I like our strategy, it is only as good as the associated tactics and our ability to make needed changes and progress. So what have we done? Like nearly all institutions of higher education, in response to the COVID-19 pandemic, we immediately bolstered our campus networks, increased cybersecurity, added classroom technology to enable multiple teaching modalities, including remote, live streaming instruction, acquired several hundred laptops for student checkout from the library, and procured a couple of hundred WiFi hotspots with unlimited data bandwidth to provide student connectivity. However, while we dealt with the immediate needs of our students and faculty, we also made changes for the post-pandemic world of higher education:

  1. We created an Academic and Student Digital Services (ASDS) organization to focus on the teaching, learning, and academic administration technologies and services that will be delightful to use and enhance our ability to achieve student success.
  2. We reorganized the existing Office of Information Technology.
  3. We combined previously distributed IT organizations.
  4. We organized a product portfolio management group to enable us to practice exceptional product portfolio management.
  5. Within these groups, we organized units to focus on:
    1. Identity and access management
    2. Communications
    3. Website, intranet, and mobile application design
    4. Business intelligence
    5. Academic systems
  6. We hired two associate vice presidents to lead our Office of Information Technology and our Academic and Student Digital Services groups.
  7. We named a Senior Director of Product and Portfolio Management and charged them to ensure our products and services are delightful and transformative.

In addition to these organizational shifts and adjustments to enhance our ability to focus and transform our work at UVU, we also initiated numerous critical projects that will enhance student success:

  1. We initiated a project to move from our traditional PBX-based phone system to Microsoft Phone System technology. This move will enable remote faculty and staff to reach out to students from anywhere in the world, using nearly any device, and appear as if they’re placing the call from their campus office. This change adds functionality, makes the experience more delightful, and saves the university money.
  2. We began a new student-centric mobile application that will enable students to accomplish many of their administrative functions on their mobile devices. They will be able to check their academic progress, set appointments and communicate with their academic advisor, add and drop classes, pay tuition and fees, and see events, classes, exams, and final exam schedules. In the future, the UVU mobile app will include voice recognition, be a digital assistant, and act as their ID card.
  3. We started a project to create a campus Intranet using MS Teams as the core component. Just today, Microsoft introduced Viva, a new product that may meet our needs. A modern intranet will provide us with the means to communicate better as a campus community.
  4. We continued creating a business intelligence system that will assist all campus areas in utilizing data and information to make informed decisions. This will help students track their progress, faculty reach more students, general communication, and facilitate the use of artificial intelligence (AI) across the institution.
  5. We began a complete rework of the UVU identity management system. This work will result in students, faculty, and staff being digital equals. While different roles and responsibilities will enable each individual to access the information pertinent to their roles, this equality will foster communication, calendaring, and virtual meetings.

These initiatives are a direct result of choosing to pursue activities that support our strategic objectives. In one way or another, they all increase the institution’s ability to help students succeed.

Summary

Utah Valley University is a special place where students, faculty, and staff understand its mission, strategies, and values. However, these are not merely the institution’s, but they’re ours, we know them, we love them, and we live them. We do all that we do to express exceptional care, exceptional accountability, and exceptional results. We are digitally transforming the university because we want our students to succeed in a digitally transforming world. So what is our secret sauce? It is a set of amazing people, driven by a common mission, directed by strategy, and guided by a set of values we’re committed to expressing in all that we do. Digital transformation at UVU is simply applying technology where, when, and how it helps people reach their full potential. We care, are accountable, and promise results!

Disruptive Communication

We all understand that communication is vital. We use one form of communication or another almost continuously. I carefully chose the word disruptive as part of this post’s title because both common definitions are applicable:

  1. causing or tending to cause disruption
  2. innovative or groundbreaking

While communication is intended to be helpful, excessive, irrelevant, or unwanted communication is disruptive. There really can be “too much of a good thing.” However, there is a disruptive, technology-enabled approach that can make communication better.

Communication

There are numerous forms and types of communication. This post focuses on what I call team communication, marketing communication, and incident or issue communication. These communication types are important but can become less useful, even disruptive, due to excessive, irrelevant, or unwanted communication, noise.

Team Communication

Various organizations and human resource departments have carried out many employee satisfaction or engagement surveys. When employees are asked what could be improved, the top answer is always the same, team communication. No matter how thoroughly I have communicated as a leader, my employees have always indicated that they want more communication.

While increased communication is initially appreciated, eventually, the increased volume and breadth of topics are taxing. Eventually, the communication becomes ineffective because the interesting stuff, from one person’s perspective, is lost within the noise of what might be interesting to others – “one man’s trash is another man’s treasure.”

Marketing Communication

Marketing is a form of communication that regularly impacts us. Believers, I am giving them the benefit of the doubt here, in a particular product or service, attempt to inform us of the benefits of their wares in the hopes that, armed with this new knowledge, we’ll acquire, purchase, or subscribe to their products. This communication is vital to businesses and individuals seeking solutions to problems. However, excessive and irrelevant marketing communication reduces its value and may become an irritant.

Incident or Issue Communication

The technology revolution brought the need to communicate technology incidents, issues, and failures to those relying on it. However, like the other forms of communication discussed earlier, too much or irrelevant information, no matter how well-intended, becomes an issue in and of itself.

Transformational Solution

So how do we successfully communicate more without communicating irrelevant information in potentially excessive amounts? The key is realizing that “beauty is in the eye of the beholder,” or, in this case, the receiver of communication. Technology provides a mechanism where those receiving communication can subscribe to the types of communication they desire and decide how they want to receive it.

Use Case

Several weeks ago, Utah Valley University’s Faculty Senate passed a resolution that essentially requested that faculty receive a push notification whenever a critical teaching tool was experiencing issues that would negatively impact their academic activities. They also requested that these communications not be the typical IT service desk responses that they deem to be too long, technical, and exhaustive.

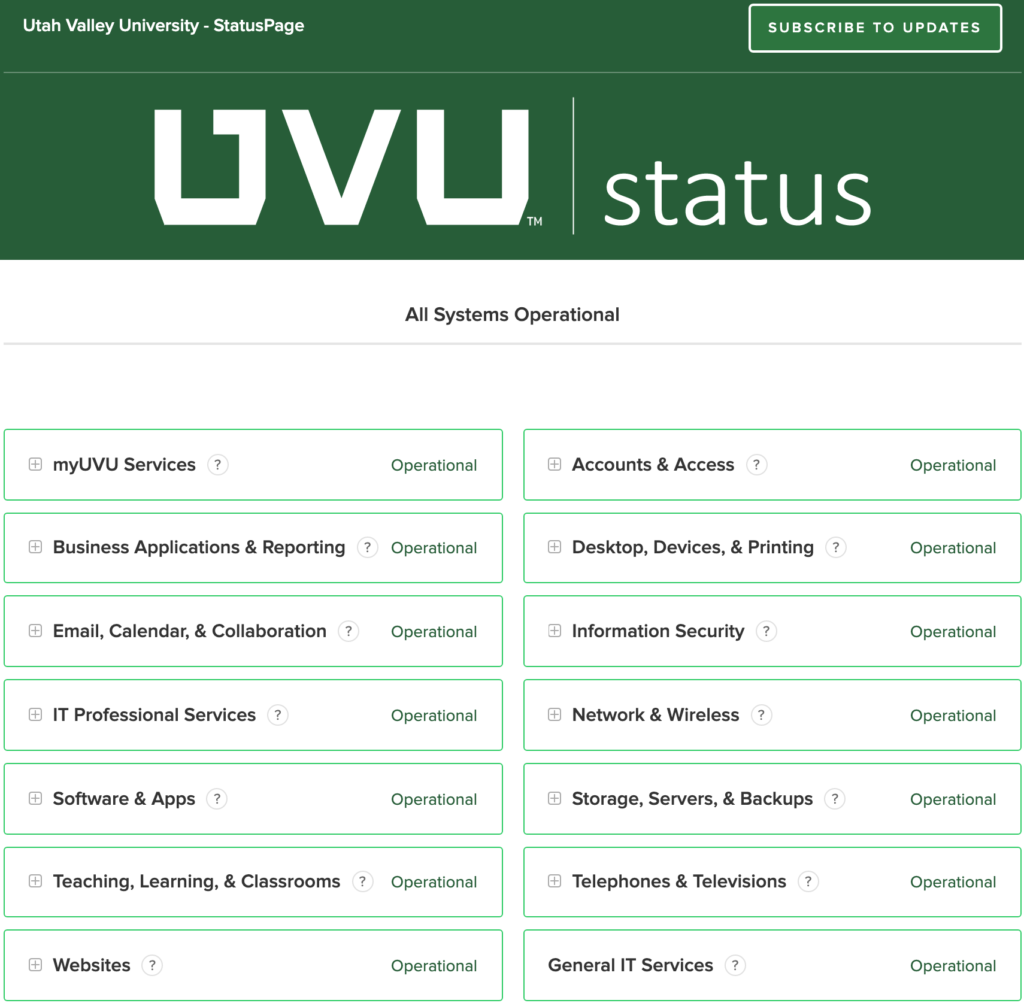
While the institution has a web site to indicate IT systems’ status, status.uvu.edu, it doesn’t meet the criteria outlined previously. It is pull oriented, requiring the faculty to visit the page in reaction to an outage or suspicion of a failure, it reports the status of multiple campus IT systems, many of which are not related to teaching or other academic activities, and it contains far too much technical detail for their needs.

A Solution

A couple of brilliant colleagues of mine read the Faculty Senate’s resolution and decided they could quickly deliver a solution to the problem. They created a tool associated with the IT status page that allows system status to be communicated via text (SMS), email, and even a webhook for integration with other applications.

In addition to providing multiple consumer selectable communication channels, they also provided a mechanism to allow the consumer to choose which service notifications they receive. So, not only can faculty now receive push notifications via text, they can receive text messages for services that impact them. They might choose to be notified about issues or outages affecting our learning management system (LMS), our student information system (SIS), or our classroom technology. They can choose not to be notified about issues and outages regarding systems that don’t impact them. Finally, they can change their settings at any time to meet their changing needs.

Generalization

While the tool described above is for IT incident communication, the principle applies to team and marketing communication. I often hear colleagues complaining about institutional or marketing communication being overwhelming, irrelevant, and disruptive. Many indicate that they delete the communication, believing that it isn’t important or critical to their work.

Imagine a system that enables institutional consumers to subscribe to the content they are interested in and not receive the rest. Also, they could choose the communication channel they’d like to use. In fact, by combining these two features, individuals could choose the information they would like to receive via text, what they would like to receive via email, what they would like to receive through other channels, and what they don’t want.

By allowing consumers to prioritize what they receive and how they receive it, they can remove disruptive noise from their work and lives. This helps them be more productive. The communication they receive will be more impactful and less disturbing.

With such a mechanism in place, a broader set of communications can be supported and tolerated. Institutional entities such as fine arts, performing arts, athletics, clubs, etc., could be invited to communicate as they see fit. In current systems, this invitation would flood our inboxes and increase our level of frustration. With this new paradigm, consumers would receive what they want and discard the rest.

Even external entities could be invited to communicate with and market to our institutional community. For example, a flower shop or restaurant may want to market to our students, faculty, and staff. Such involvement shouldn’t bother individuals or the institution because the only receivers of such communication would be those who opted to receive it. If a vendor becomes disruptive, consumers will unsubscribe.

One final thought. There are a few communication types that all members of our community should receive. For example, emergency notifications should be received by everyone. Having all users receive this type of critical communication is easily provided for.

Summary

In this post, I described several types of communication and pointed out their importance. I also pointed out that when we communicate too often and too broadly, it becomes irrelevant to some. To avoid this issue, we should build a communication platform where our community members can subscribe to what they want and unsubscribe from the rest. We currently have this system in place for IT incident reports but should create a more general tool, let’s call it NotifyMe.

Education 4.0 and Dr. David Kellermann

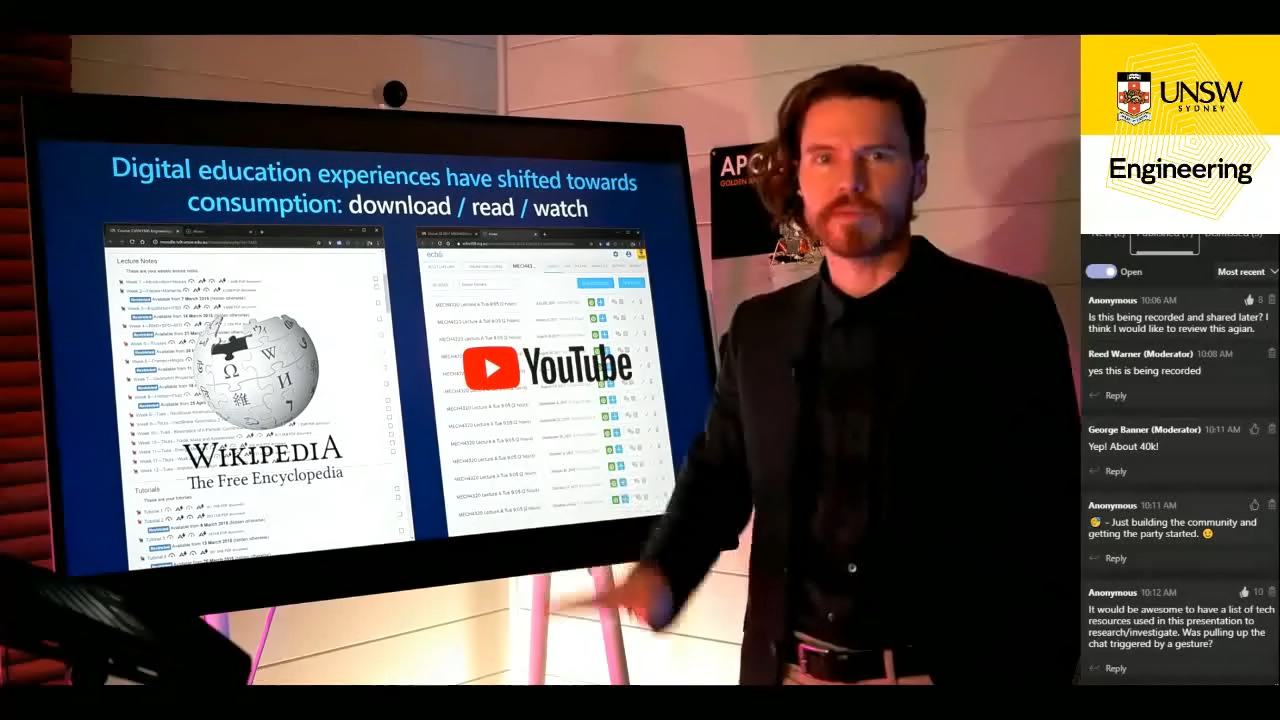
Dr. David Kellermann from the University of New South Wales spoke to the Utah Valley University (UVU) community at a recent UVU Digital Transformation Seminar. His topic was Education 4.0 and the integrated tools he uses to enhance his students’ engagement and learning. His presentation can be seen here, by members of the UVU community, and on YouTube. This post will briefly discuss past and current educational practices, introduce Education 4.0 and highlight a few key takeaways from Dr. Kellermann’s lecture.

Education: Past and Present

Education 1.0 was developed centuries ago and was refined up through the 20th century. Education 2.0 began when educators and students started using digital technology to enhance their educational experience. Education 3.0 is best characterized by the availability of learning content through mechanisms other than traditional higher education. Today, many have access to the Internet, YouTube, Microsoft Learn, LinkedIn Learning, Pluralsight, and other rich content providers. Learning resources are available to students when and where they want them and at little or no cost.

However, higher education institutions are still creating much of their own content and providing it on their terms. Course offerings, schedules, student information, and institutional content are often consumed by and exposed through monolithic and dated tools such as student information systems (SISs), learning management systems (LMSs), etc. Often the organizations delivering these tools harvest a vast amount of institutional and student information to improve their offerings and develop new technologies to market. To make matters worse, the more intellectual investment we make in such tools, the more difficult it is to move to something better.

Many of our students want to move beyond this traditional educational model. They are demanding Education 4.0 functionality such as collaborative real-time editing, video calls/communication, chat interaction, mobile functionality, cloud storage, and the ubiquitous use of AI and natural language processing. In his lecture, Dr. Kellermann noted that even his Education 3.0 online work consisted of a collection of PDF lecture notes and an associated list of video captured lectures. He realized that the content on YouTube and other sites was superior in many ways. This inspired him to make online learning better and even superior to on-campus learning.

Education 4.0

Education 4.0 parallels the 4th industrial revolution (Industry 4.0), where data, artificial intelligence (AI), machine learning, robots, the Internet of things (IoT), and automation dominate. Future jobs will require higher levels of proficiency in these and other technical fields. In a general sense, Education 4.0 must provide the training for a future Industry 4.0 workforce.

Education 4.0 is transforming our academic approach, including the design, delivery, and assessment of teaching and learning. We have to transform content creation and acquisition, delivery mechanisms, learning spaces, assessment approaches, student mentoring, advising services, and learning tools. Education 4.0 students must use and be immersed in the tools that Industry 4.0 demands: data analysis, artificial intelligence, machine learning, automation, robotics, Internet of things, etc.

Takeaways

There are many interesting aspects of Dr. Kellermann’s setup and work. I’ll point out a few here, but you may well find others that you find more compelling in his lecture. His work is clearly in the realm of Education 4.0 so hang on, keep your arms and legs within the ride at all times, and enjoy a glimpse of the future.

Microsoft Teams

At the center of Dr. Kellermann’s toolset is Microsoft Teams. However, he uses a variety of Microsoft tools to add functionality to his class offerings. If you are unfamiliar with Teams, you can learn more about it from the UVU Digital Transformation Learning Gallery. Just think of your class as a team and Teams being the tool that allows you to share files with them, chat with them, initiate video meetings, interact with applications in real-time, assess student accomplishment, give them feedback, and share applications with them. It’s the hub that every topic below depends on.

Dr. Kellermann creates a team for each class, including all students in the class, his assistants, and himself. Teams have channels, and he creates a channel for each week of his class. Each channel contains learning objects, assessment tools, assignments, etc., related to a particular topic. Within each channel, there are tabs that are essentially applications. There may be a chat tab, a gradebook tab, an assignment tab, etc. Each channel may have the same tabs or a different set of tabs depending on the need.

Technology Setup

Dr. Kellermann’s technology setup is novel and intriguing. I may miss a few details, but essentially he has two camera views and a screen view to stream to his students. He can switch between these three views with a simple handheld remote. The primary camera view is of him lecturing beside a Microsoft Surface Hub. From here, he can use Teams to display a class notebook created using OneNote, present Powerpoint presentations, review documents, etc. The Surface Hub allows multi-touch functionality and on-screen marking with digital ink.

The second camera view is from a camera on top of the Surface Hub. This view is useful when working on a problem on the Surface Hub, as we might do on a whiteboard. This enables him to work “at the board” while still facing the remote students.

The screen view of the Surface Hub allows fine detail to be viewed by a remote audience. The surface hub displays branding for the institution and a picture in picture feature allowing Dr. Kellermann to be seen even during screen sharing. It also includes a chat area where students and Dr. Kellermann can communicate and, more importantly, where students can communicate freely and answer one another’s questions.

Dr. Kellermann also has a separate screen where he can easily view chats and acquire questions to be answered. Finally, he has included reasonable lighting, a good sound system, and a color adapting light source to backlight the screen. You’ll fully appreciate the setup after viewing him in action.

Class Recordings

Class recordings can be very useful for students. Using Teams, a class recording is as simple as pushing a virtual button. The entire meeting, including the chats, are recorded and stored in Microsoft Streams. Once in Streams, recordings are transcribed, and the resulting texts are available for reading, searching, etc. It is simple to search the transcription for topics of interest, click on that portion of the transcription, and the associated video starts playing at that point. Recorded videos can be manipulated using Microsoft’s Power Automate to create a video gallery that can be included within Teams as a tab within the associated class.

Legacy Courseware

We all know it is a tremendous amount of work to move developed courseware from one learning management system to another. Dr. Kellermann points out that he no longer uses an LMS at all, but moving courseware to a completely different type of tool all at once isn’t easy either. Not to fear, an LMS can be easily added to Teams as a tab within a course. What’s better is that since the students are within a class in Teams, they have already authenticated. When they go to the LMS tab, they don’t need to authenticate again, and they are taken directly to the class associated with their class in Teams. This ability allows for a metered transition from a class using an LMS to one no longer dependent on it. This enables faculty and staff to collaboratively determine a smooth and well-supported migration.

Bots and Artificial Intelligence

Dr. Kellermann has invested significant time and resources into developing a question bot, called QBot, based on Microsoft’s Bot Framework. He has made QBot publicly available on GitHub. When a student inserts a question in the chat window and references @Q, the QBot looks up the class and section the student is in, determines the teacher’s assistants associated with the class, and sends them a cell phone notification indicating they have a question to respond to.

Also, QBot uses natural language processing and AI to parse the question and determines if it “knows,” with a high probability, the answer to the question. If QBot is confident, it responds immediately with an answer. Remember where we discussed the transcriptions from recorded class lectures? QBot also has access to those transcriptions, and if it believes that the question is addressed in a lecture, it points the student to that very moment of class instruction. If QBot isn’t confident that it “knows” the answer, it remains silent. However, it recognizes when the teacher’s assistant responds and uses that answer to enhance its collection of question and answer pairs; better luck next time. It should be noted that AI is not used to replace people but connect them and enhance their interactions.

Data, Data, and More Data

With the class in Teams, there is a vast amount of resulting data that can be used to enhance education. This data is private to the institution and not accessible by the tool provider, in this case, Microsoft. For example, attendance, quiz outcomes, homework scores, and test results for each student for each topic are easily extracted. Another Microsoft tool, Power BI, can create dashboards for visualizing and acting on this data. Additionally, AI can be employed to look at previous semester data with associated final exam and class scores to predict where each student needs help. This data can be used to construct a personalized study guide to maximize student learning and help them succeed.

Summary

We are currently at the end of an era, Education 3.0, but our students are running ahead of us and expecting us to join them in the era of Education 4.0. To join our students, we must transform the institution; we must change our technology architectures, culture, tools, processes, and practices. Dr. David Kellermann has worked hard to develop a set of tools and practices that work well for him. I am confident that each institution, each faculty, and our great students will find a slightly different set of tools and practices that are right for them. I’m excited about Education 4.0 at Utah Valley University and can’t wait to see the student success it yields!

Digital Transformation Strategy

Introduction:

A strategy should inform an institution where business process improvements will have the largest impact on realizing its mission. Both for-profit and non-profit institutions should pursue projects and initiatives that help them reach their strategic goals. A strategy should help guide what projects and initiatives are pursued.

In a for-profit institution, the main strategy is to increase profits. Projects should be pursued if they have the potential to increase revenue, decrease expense, or both. In such a setting, it is reasonably straightforward to compute a financial return on investment (ROI) for digital transformation projects and initiatives and use it to prioritize them.

In a non-profit institution of higher education, our main strategy is to help students succeed. Projects and initiatives should be pursued to help the institution reach its strategic goals. Computing a financial ROI in this setting is not straightforward and perhaps not beneficial; therefore, we need an alternative mechanism for prioritizing which projects and initiatives to pursue. The ideal metric is a measure of a project’s ability to decrease the gap between where an institution is concerning its strategic goals and where it will be after the project is complete, i.e., its strategic value. Those projects with the most potential to decrease the strategic gap have the highest strategic value and should be pursued.

This post will describe the creation of the strategy map for the UVU Division of Digital Transformation. I’ll also describe three ontologies we’ve created:

  • An impact ontology that illustrates the impact divisional business processes should have on our strategic objectives.
  • A performance ontology that describes the impact our business processes are currently having on our strategic objectives.
  • A project ontology that illustrates each project’s strategic value or its ability to close strategic gaps.

The impact and performance ontologies are used to determine the strategic gap between possible impact and current performance. The project ontology determines which projects have high strategic value in closing the identified strategic gaps. Finally, a list of projects and initiatives, prioritized using their strategic value, is presented.

Utah Valley University

In early 2019, Utah Valley University (UVU) organized a Digital Transformation Task Force, which issued its final report in April 2019. In their report, the task force defined digital transformation like this:

“Digital transformation is the process of applying technology to fundamentally change how organizations operate and provide value to those served. Digital transformation requires an integrated enterprise approach to workflow, process, data management, technology, and culture.”

The use of digital technology and an accompanying change in culture will allow the university to reduce complexity, function efficiently, and provide delightful products, processes, and services to our students, faculty, and staff. While digital transformation strategies and tactics must be aligned with the institutional mission and strategic initiatives, they must also be easily understood and implemented by those participating in the transformation of digital technology, culture, and institutional practice.

Institutional Mission and Strategy

Digital transformation efforts must be aligned with institutional goals and strategy. UVU has an exceptional strategy document entitled Vision 2030. Vision 2030 includes the UVU Mission Statement that reads, “Utah Valley University is an integrated university and community college that educates every student for success in work and life through excellence in engaged teaching, services, and scholarship.” Vision 2030 outlines three strategies, with accompanying priority initiatives, employed to accomplish its mission:

  1. Enhance student success and accelerate completion of meaningful credentials
    • Implement the UVU Completion Plan 2.0 (2019-2023)
    • Assess and remove barriers at every stage of the student life cycle
    • Support completion through comprehensively designed curriculum and services
    • Enhance educational quality through the recruitment and retention of excellent and engaging faculty and staff
  2. Improve accessibility, flexibility, and affordability for all current and future UVU students
    • Build out a coordinated multi-campus plan
    • Expand flexible educational and online offerings
    • Strengthen outreach to and support for underrepresented students
    • Maintain commitment to affordability and accessibility
  3. Strengthen partnerships for community, workforce, and economic development
    • Create seamless processes and practices for student transition from K-12 to UVU
    • Improve industry partnerships to meet workforce and community needs
    • Strengthen engaged learning and community engagement opportunities for students, faculty, and staff

Strategy Map

A strategy map is a diagram that shows an organization’s strategy on a single page. A strategy map has three significant uses:

  1. It helps every employee understand their organization’s overall strategy and where they fit in.
  2. It helps keep everyone literally on the same page.
  3. It helps employees see how their work helps the institution meet its strategic objectives.

At the top and center of a strategy map, we place the organization’s mission or vision statement. Stacked down the map’s left side are four perspectives: financial, customers or stakeholders, internal processes, and enablers. A for-profit enterprise would typically place the perspectives from top to bottom in the order previously described. In a non-profit organization like UVU, we place the financial perspective at the bottom. Making money is not our aim, but financial objectives support everything else we do.

Within each perspective, we place a small number of strategic objectives. Arrows indicate how one or more strategic objectives help accomplish others. Finally, we add a weight to each strategic objective indicating the amount of effort and resource we want to commit to them currently. While most aspects of the strategy map remain as is for a considerable length of time, the weights assigned to each objective should be regularly reviewed and potentially adjusted to meet changing needs.

We created a strategy map for Digital Transformation at UVU with Brett Knowles and others at Hirebook. Brett and his colleagues patiently helped us craft our strategy, asked probing questions that refined our language, and acquainted us with powerful ontologies and techniques to connect our project work with our strategic objectives.

Figure 1: Strategy map for the UVU Division of Digital Transformation, including strategic objectives and associated weights.

At the top and center of the strategy map, illustrated in Figure 1, is an abbreviated form of the UVU Mission Statement. You can see the four perspectives down the figure’s left side: stakeholders, internal processes, enablers, and financial. We’ve added brief definitions of each perspective to help us remember who or what is included in each. Within each perspective, we have added strategic objectives.

Within the financial perspective, we have a single strategic objective, Plan, Budget, and Assess, which represents the UVU planning and budgeting process known as PBA. We used a shared governance approach, with much discussion and compromise, to determine the weight associated with each strategic objective. In this case, we determined that we’ll spend 10% of our effort and resources on this objective. This strategic objective supports all other objectives in the strategy map. Arrows have been omitted for clarity.

The enablers perspective contains three strategic objectives: Be Responsive, Invest in Staff Development, and Manifest UVU Values. Accomplishing these strategic objectives is essential to enable the organization to accomplish the strategic objectives above them. We must invest in staff development to ensure they continue to be productive professionals who can deliver high-quality results. The staff must also be responsive, i.e., react quickly and positively to institutional concerns and needs. Finally, they must manifest UVU values of exceptional care, exceptional accountability, and exceptional results. This perspective will receive 35% of our effort and resources.

The perspective dealing with internal processes contains four strategic objectives: Practice Exceptional Product Portfolio Management, Provide Transformative Solutions, Strengthen Our Partnerships, and Deliver Delightful Experiences. Our division doesn’t currently have a strong practice in product portfolio management. We must develop this process to enable the delivery of the other three strategic objectives in this perspective. A strong product portfolio management process will strengthen our relationships with internal partners and enable our organization to provide transformative solutions. Together these three strategic objectives will enable our division to deliver delightful experiences to our stakeholders. This perspective will currently receive 50% of our attention and resources.

The stakeholders perspective includes three strategic objectives: Achieve Student Success, Include All Learners, and Engage Our Partners. While we organize our division, strengthen our internal processes, and develop our staff, we will only expend 5% of our effort and resources on these strategic objectives. However, these objectives are shared by all divisions at UVU. We expect that pursuing the strategic objectives in the internal processes and enablers perspectives will increase other divisions’ ability to focus on these important strategic objectives.

Impact Ontology

An impact ontology describes the impact that business processes ideally have on strategic objectives. The UVU Division of Digital Transformation has nine major business processes:

  1. Financial
  2. Product Portfolio Management
  3. Operations
  4. Service Management
  5. Human Resources
  6. Research and Development
  7. Data Delivery
  8. Risk and Security Management
  9. Digital Transformation Strategic Planning

Note that these nine business processes are not necessarily organizational units.

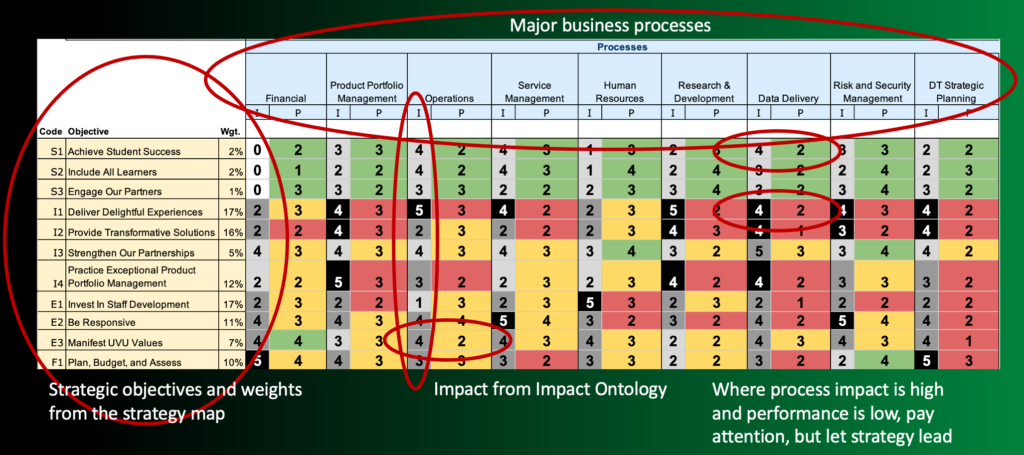
Figure 2: Impact ontology for the UVU Division of Digital Transformation, including major business processes, strategic objectives, and indicators of the potential impact business processes ideally have on associated strategic objectives.

The impact ontology illustrated in Figure 2 shows the impact that business objectives have on achieving strategic objectives. Our nine business processes are included across the top. The strategic objectives and associated weights from the strategy map are included down the figure’s left side. We have a value from zero to five at the intersection of each business process and strategic objective. Like the strategic objective weights, these values were obtained through a shared governance exercise and much discussion. Zeros indicate that the associated business objective has no impact on reaching the associated strategic objective. In contrast, fives indicate that the associated business process strongly influences reaching the associated strategic objective. The grey levels are added to aid in identifying impactful business processes. For the UVU Division of Digital Transformation, the Operations business process impacts our strategic objective of Delivering Delightful Experiences but does not impact our objective of Invest in Staff Development.

We can glean other interesting information from an impact ontology. For example, intersections containing fours or fives identify business processes that greatly impact the associated strategic objectives. We should monitor these processes using key performance indicators (KPIs) and improve them. Additionally, a business process owner can use the column associated with their business process to determine where to deploy their best people and the most resource for the greatest impact. Finally, looking across a row tells us which business processes should be represented in activities intended to enhance the institution’s ability to achieve the associated strategic objective.

Performance Ontology

The performance ontology illustrated in Figure 3 shows a relationship between business processes and strategic objectives.

Figure 3: Performance ontology for the UVU Division of Digital Transformation, including major business processes, strategic objectives, impact measures, and indicators of how the current performance of business processes are impacting associated strategic objectives.

In this case, the relationship we’re mapping is how well our organization performs each business process to pursue associated strategic objectives. Like the previously discussed impact ontology, the performance ontology includes our nine business processes across the top. The strategic objectives and associated weights are included down the figure’s left side. For convenience, we have included the impact ontology values from Figure 2. We have added a score from one to five, indicating how our organization performs each business process to pursue associated strategic objectives. These scores were obtained through self-evaluation and much discussion. In the future, these scores should be obtained through the measurement and evaluation of key performance indicators (KPIs). The color-coding indicates the magnitude of the strategic gap. The strategic gap is calculated by taking the difference between the impact a business process should have on a strategic objective and the actual performance we’re achieving and then multiplying by the strategic objective’s weight.

The color-coding of the performance ontology directs attention to important areas where there is a strategic gap. For example, the Data Delivery business process and Deliver Delightful Experiences strategic objective. In this case, the difference between the potential impact of the business process, determined to be a four, and our current performance, determined to be a two, multiplied by a strategic objective weighting of 17 creates a significant strategic gap of 34, is color-coded red, and demands our attention. The Operations business process has a potential impact of four on Manifest UVU Values while our performance receives a value of two. The impact and performance values are identical to those of the previous example. Still, a lower strategic objective weighting of 7 results in a strategic gap of 14, is color-coded yellow, and deserves less attention. Similarly, the Data Delivery business process’s desired impact on Achieve Student Success is a four while our performance yields a two. A strategic gap exists, but because the importance of that strategic objective is low, the strategic gap of 4 doesn’t warrant our attention and is color-coded green.

Strategic Gap

As previously described, the difference between impact and performance, weighted by the importance of a strategic objective, results in a strategic gap measure.

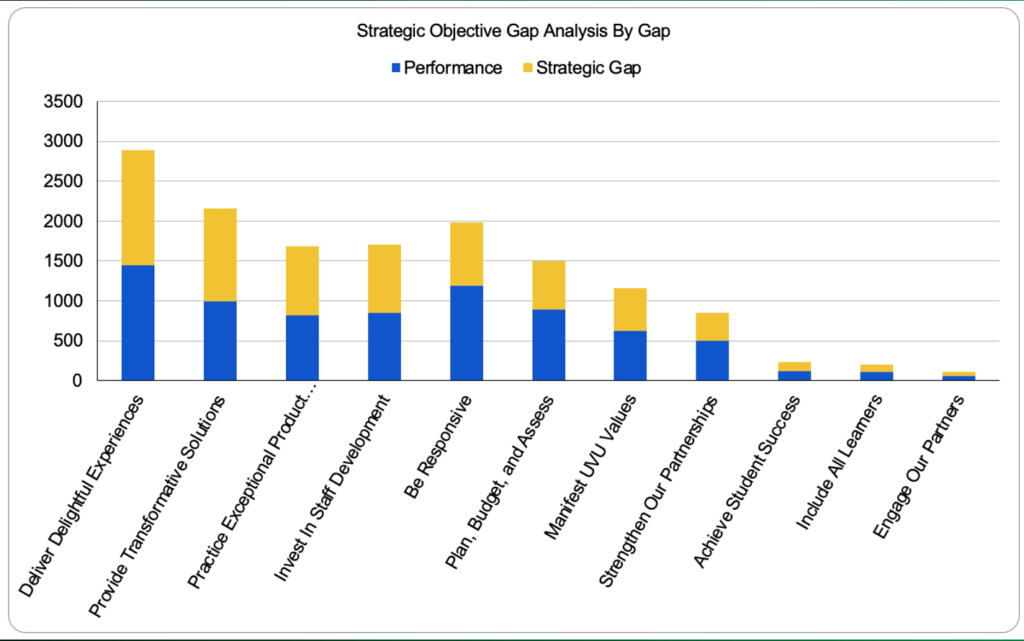
Figure 4: Strategic Objective Gap graph where the total bar height indicates the desired level of impact, the blue bars represent the current performance level, and the yellow bars the magnitude of the existing strategic gap.

The yellow portion of each bar illustrated in Figure 4 represents the total strategic gap for the associated strategic objective. The yellow portion’s height is the difference between the desired impact, total bar height, and our current performance, height of the blue portion. In the figure, the strategic objectives are ordered from greatest to the least strategic gap. The largest strategic gap in Figure 4 is for the Deliver Delightful Experiences strategic objective.

Each bar’s height is the total impact we desire to exert on each of the strategic objectives. This is computed for each strategic objective by multiplying the strategic objective’s weight and the sum of the business process impacts for the given strategic objective. This result is multiplied by five to enhance visualization.

The blue portion of each bar represents our current performance towards each of the strategic objectives. This is computed for each strategic objective by multiplying the strategic objective’s weight and the sum of the business process performance values for the given strategic objective. This result is also multiplied by five to enhance visualization.

Project Ontology

The previous section illustrated a process for determining which strategic objectives have significant strategic gaps and need attention. We want to pursue the projects and initiatives with the highest strategic value or the greatest promise of decreasing strategic gaps. Figure 5 shows the project ontology, where we can discover which projects have that promise.

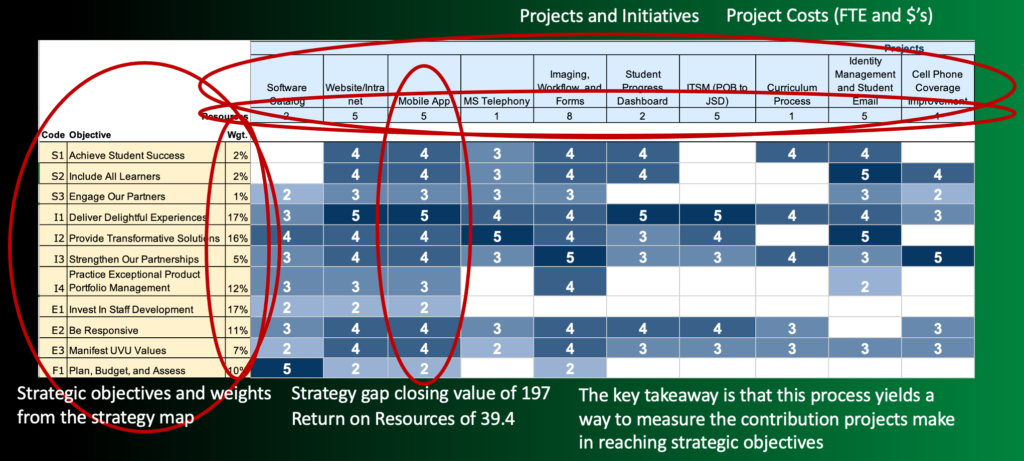
Figure 5: Project ontology showing the impact various projects have on closing the strategic gap for each strategic objective, their strategic value.

The project ontology includes the strategic objectives on the figure’s left side and across the top a list of potential projects and their costs. The costs are in $100,000 increments and include cash and the value of required labor.

The values within the ontology range from zero (blank) to five, where zero indicates the associated project has no ability to close the strategic gap of the associated strategic objective. These projects have no strategic value concerning the associated strategic objective. Five indicates that the associated project has high strategic value and will significantly decrease the strategic gap of the associated strategic objective. For example, a project to create a mobile application will result in a product that significantly closes the gap for several strategic objectives, including Achieve Student Success, Include All Learners, Deliver Delightful Experiences, Provide Transformative Solutions, Strengthen Our Partnerships, Be Responsive, and Manifest UVU Values. This project has a high strategic value.

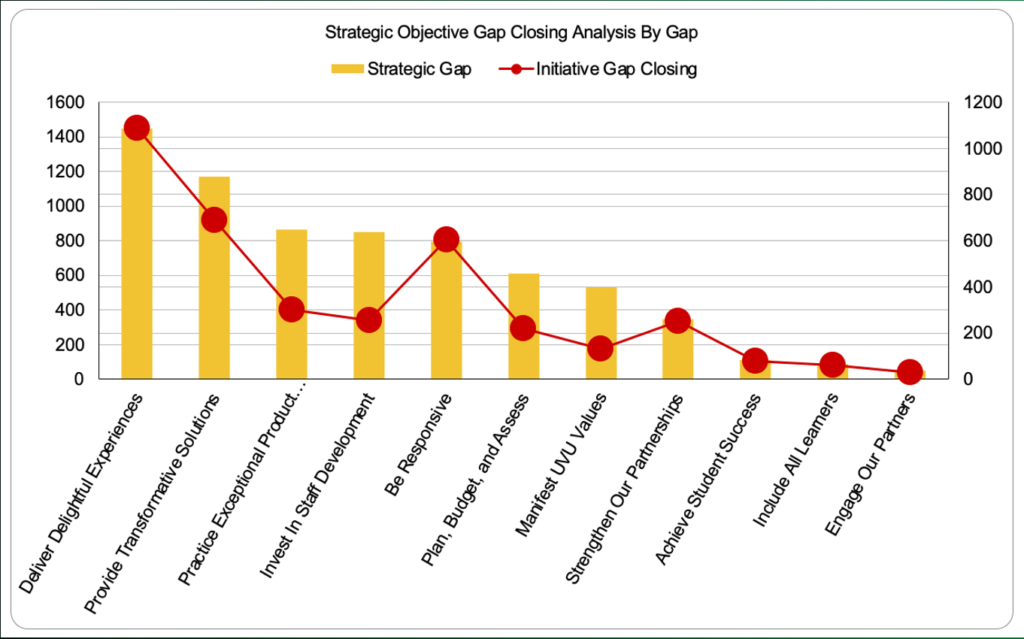
Figure 6: Strategic Objective Gap Closing graph illustrates the ability of a suite of proposed projects in closing the strategic gap for various strategic objectives.

In Figure 6, the yellow bars represent the strategic gap for each strategic objective, as described in the previous section. The red dots indicate the sum of the projects’ strategic values that impact the associated strategic objective. The successful completion of the proposed projects, which have significant strategic value, would nearly eliminate the strategic gap associated with several objectives: Deliver Delightful Experiences, Be Responsive, Strengthen Our Partnerships, Achieve Student Success, Include All Learners, and Engage Our Partners. In contrast, the other strategic objectives receive insufficient project work of sufficient strategic value to eliminate their strategic gaps.

If resources are fully allocated, the results illustrated in this figure may be used to adjust what projects and initiatives are pursued to distribute the strategic value more uniformly. Alternatively, if more resources are available to pursue additional projects, the graph indicates where strategic value is needed, which may be used to select appropriate projects.

Project Priority and Value

As shown in the previous section, a suite of projects may significantly decrease strategic gaps. However, the ability to close a strategic gap may also be attributed to individual projects. We should pursue projects and initiatives that have significant strategic value, i.e., significantly decrease strategic gaps.

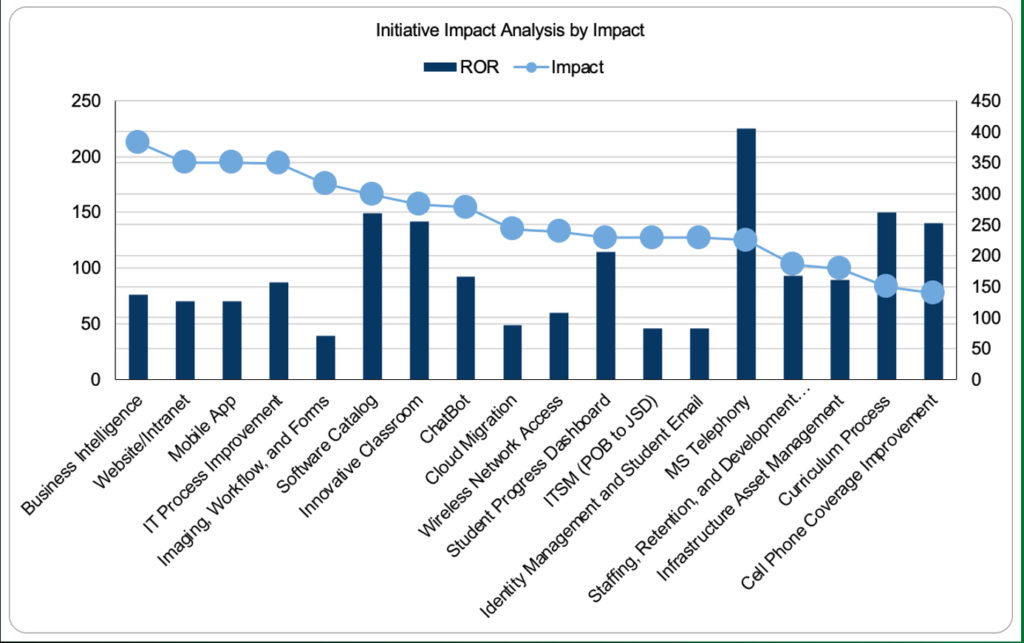
Figure 7: Initiative Impact illustrates the strategic gap closing value of each of the proposed projects and initiatives. The dark blue bars illustrate project value in terms of strategic value per dollar spent.

Figure 7 illustrates the strategic value or gap-closing ability of each project and initiative. The initiative with the highest strategic value is creating a business intelligence unit and associated governance and processes. Projects to create a new web site, intranet portal, and mobile application are also strategically valuable.

The dark blue bars in Figure 7 indicate the impact value of each project. This is simply a project’s strategic value divided by the project’s cost. The MS Telephony project may not be strategically impactful, but it saves the institution money and has nearly zero cost.

As a division, we will seek approval and funding to pursue the strategically most impactful projects, those with high value, and those that save the institution money that may be applied to other high impact projects.

Summary

As pointed out earlier, a strategy should inform where improvements in business processes should be made and what projects and initiatives should be pursued. In this post, I described a process to determine the gap between an organization’s desired performance level and its current performance concerning strategic objectives. Also, a method to determine the strategic value of projects and initiatives was described. Combining these two activities enables us to evaluate proposed projects and initiatives in terms of which will best help us meet our strategic objectives. In environments where ROI is difficult to determine, this is a powerful tool to help us realize our mission.

My Career Change

Monday, March 16, 2020, I ended a 31-year career at Brigham Young University (BYU) and started in a new role at Utah Valley University (UVU). I accepted the newly created position of Vice President of Digital Transformation and CIO. I was hopeful that I could stay above the tactical problems associated with IT systems and focus on the institution’s digital transformation. While that was a worthy goal, COVID-19 put a damper on most strategic thinking and a significant focus on getting 4,000 courses online and ensuring that the Office of IT-supported that effort.

While the initial intent was to get to know my new team, help them understand my expectations and plans, and hire an admin and an associate vice president, COVID-19 put an end to all of that. My initial introduction to the team was a virtual team meeting, and our message was to stay safe, stay alive, and work from home if you can.

This week wasn’t the perfect traditional first week, but it was ideal for me to join the team at UVU. I think I have already contributed, and I hope to contribute much more as we move forward. I am encouraged by how quickly the cabinet, led by President Astrid S. Tuminez, adapts to new challenges and moves to new communication mechanisms and processes. She’s a great leader, and her team is anxious to serve UVU students. We hope the students are safe and ready to learn remotely.

css.php