This post is the eighth of an ongoing series of articles documenting and describing our RV electrical upgrade. Our previous post in this series described some non-power-related improvements to the pass-through storage area. These improvements included thermal insulation and an acquired storage system. In this post, we describe a simplified model of our battery bank, the wiring of our system, the resistance contributed by each component and associated cables, and the expected system voltage drop. Our goal is to keep our voltage drop to 2.5% or less as recommended in Victron’s Wiring Unlimited.
Our Battery Bank
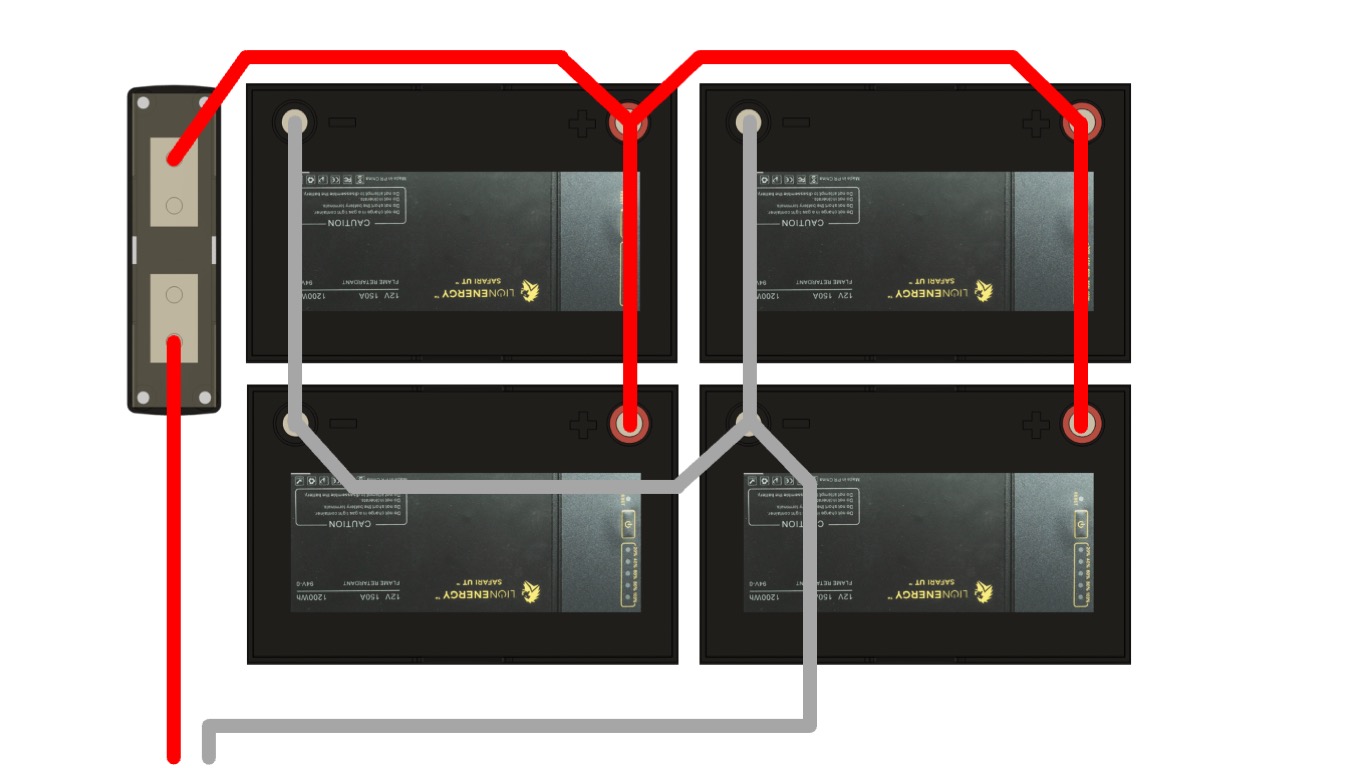
We previously discussed the idea of installing a 24 V system to reduce system currents, but we have determined to stay with a 12 V system. A 12 V system keeps things straightforward and reduces our time to completion. We’ll use the “Halfway” parallel configuration for our battery bank as described in Wiring Unlimited and illustrated in Figure 1. We chose this approach because it simplifies the cable layout given the physical placement of our batteries.
The Halfway configuration ensures the circuit path from each battery’s positive terminal, through an otherwise balanced load, and back to the same battery’s negative terminal is the same length for each battery. Strictly speaking, the resistance, measured in ohms (Ω), should be kept equivalent and minimal, but length is correlated to resistance and is easier to measure. Our design will opt for wiring convenience over strict adherence to keeping each path equal in length. Using wires of various lengths will introduce minor deviations from the ideal.
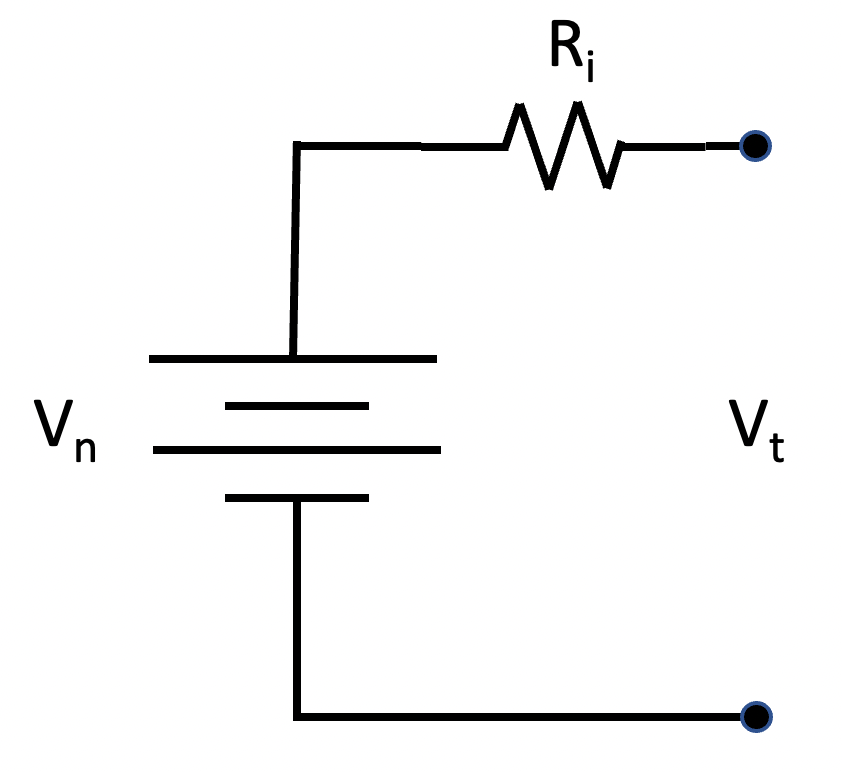
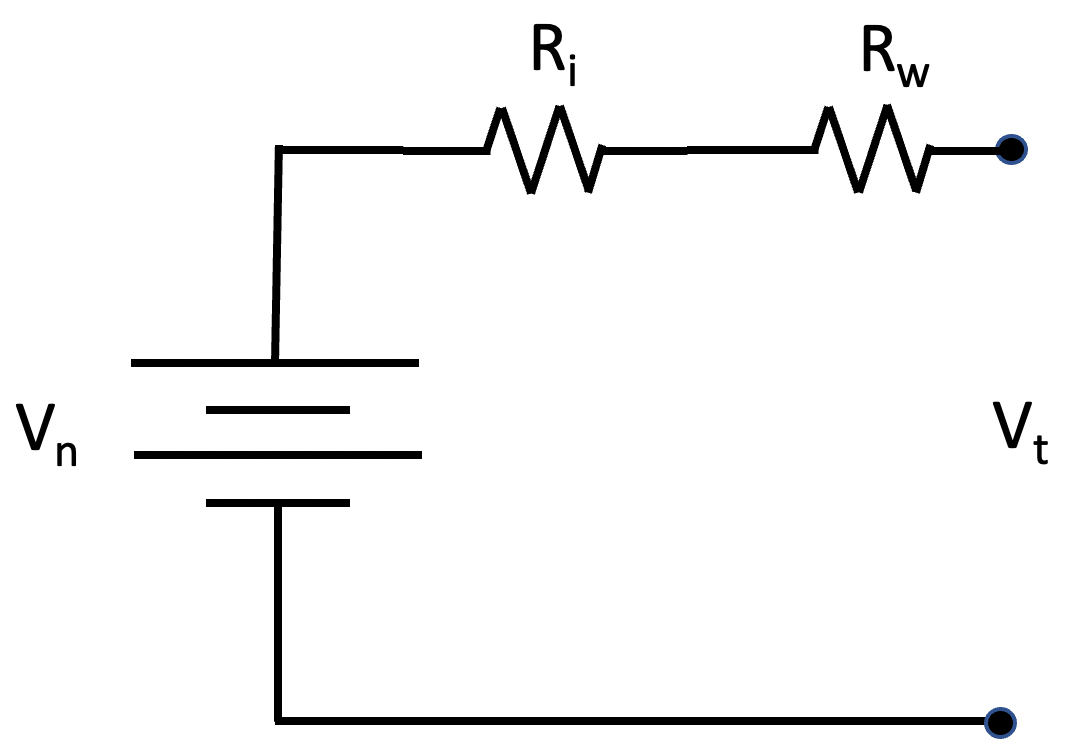
We developed a simplified model of our battery bank to determine if our design is viable. As the load on a battery increases, the voltage measured at the terminals decreases due to internal battery resistance. The battery model illustrated in Figure 2 includes an ideal battery and a resistor representing the battery’s internal resistance. Vn represents the battery’s nominal voltage, Ri represents the battery’s internal resistance in ohms, and Vt represents the voltage measured between the battery’s terminals. This model predicts that as the current draw from the battery increases, the voltage seen at the terminals will be lower than the nominal voltage; Vt = Vn – Ri*i, where i is the current drawn from the battery measured in amperes.
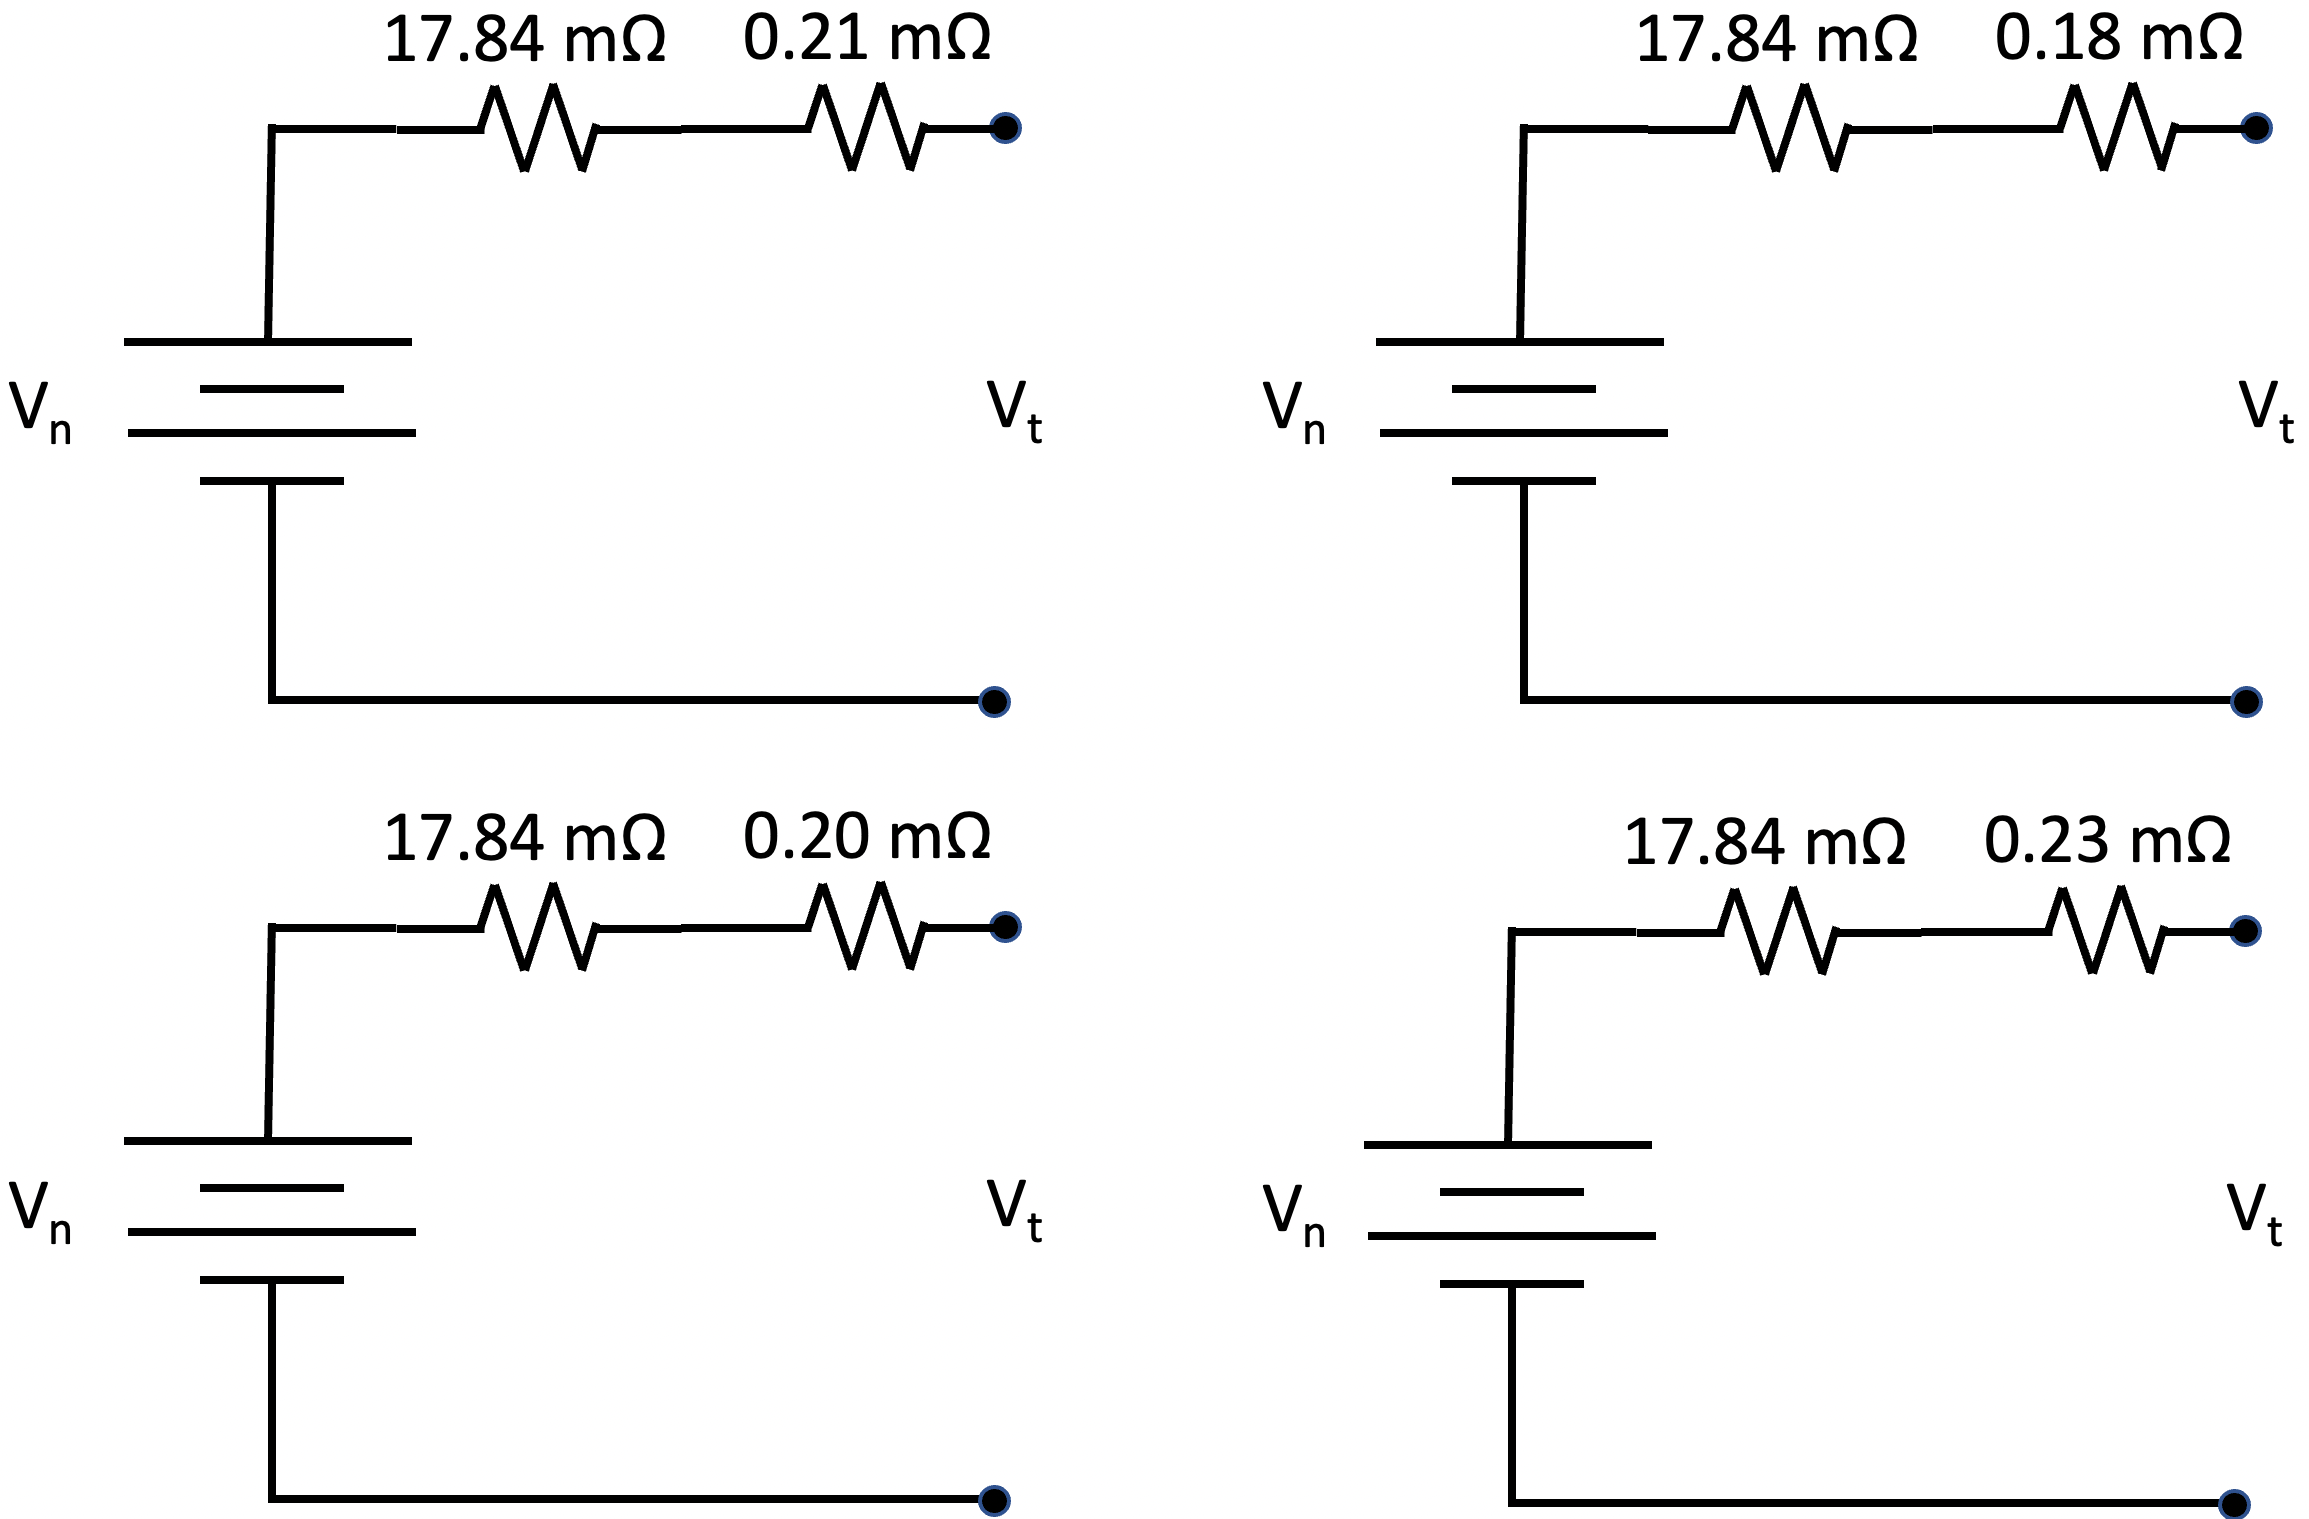
Our battery bank consists of four batteries interconnected with cables. These cables add additional resistance, Rw, to the system, as illustrated in Figure 3. Four of these models, each with a potentially different value for Rw, connected in parallel represent our battery bank.
Now let’s put some numbers to these models and see what we expect from our battery bank. Lion Energy reports that the internal resistance of their UT 1200 battery is 17.84 mΩ. Using a Keithly 2450 SourceMeter, we measured the resistance of each 4/0 cable we created. We crimped lugs to both ends of each cable and measured each cable’s resistance from the center hole of one lug to the center hole of the other. There are two 11″ cables measuring at 0.10 mΩ for the red cable and 0.13 mΩ for the black cable. There are four 6.5″ cables measuring at 0.08 mΩ for the two red cables and 0.10 mΩ for each of the two black cables. Figure 4 illustrates the simplified models of our four batteries using the Lion Energy reported battery internal resistance and the measured values of the 4/0 wires interconnecting our batteries.
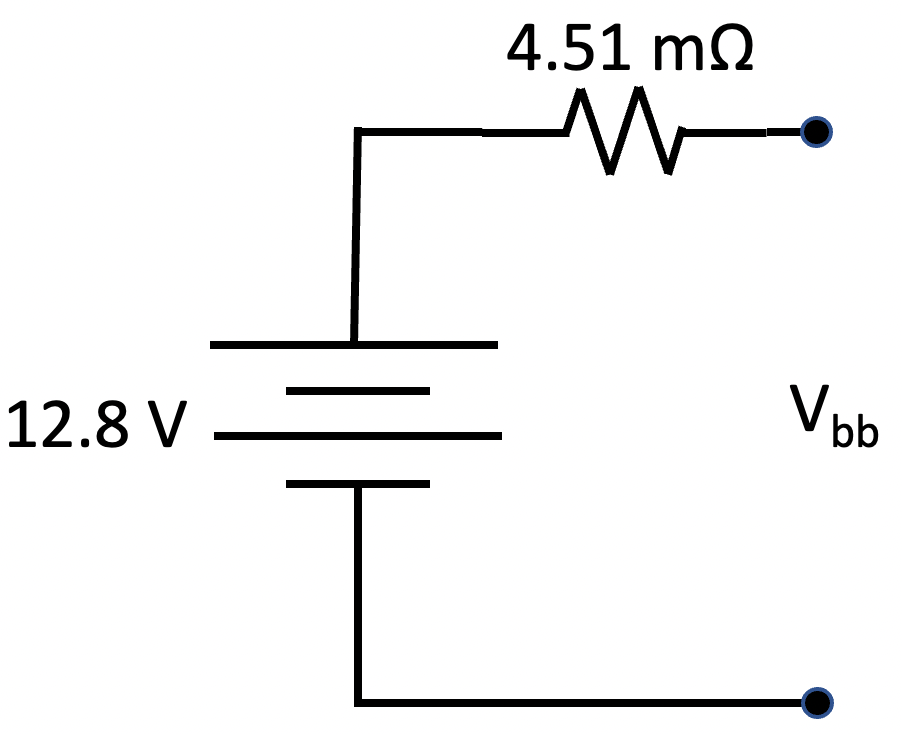
After connecting the four models illustrated in Figure 4 in parallel, circuit analysis and simplification results in the model shown in Figure 5. In this model, the resistance of the entire battery bank is 4.51 mΩ, with the nominal voltage being 12.8 V. Vbb represents the voltage seen across the two battery bank terminals that connect to the remainder of our power system.
Note that the interconnect resistance is relatively small compared to the internal resistance of each battery. If the wiring resistance were zero, the model for the battery bank would be trivial to acquire. The battery voltage would have the value Vn, and the series resistor would be the internal resistance of a single battery divided by the number of batteries. With an internal resistance of 17.84 mΩ, the ideal series resistor would have a value of 4.46 mΩ. Note that our model’s resistor has a value of 4.51 mΩ, just a bit more than the ideal. We could see currents approaching 275 A in our system. At 275 A, our model predicts that Vbb would be 1.24 V lower than Vn, or 11.56 V, while the ideal model predicts a Vbb of 11.57 V, not a significant difference. We expect typical maximum currents of 150 A. At this level, we expect Vbb to be 0.68 V lower than Vn, or 12.12 V.
Our Power System
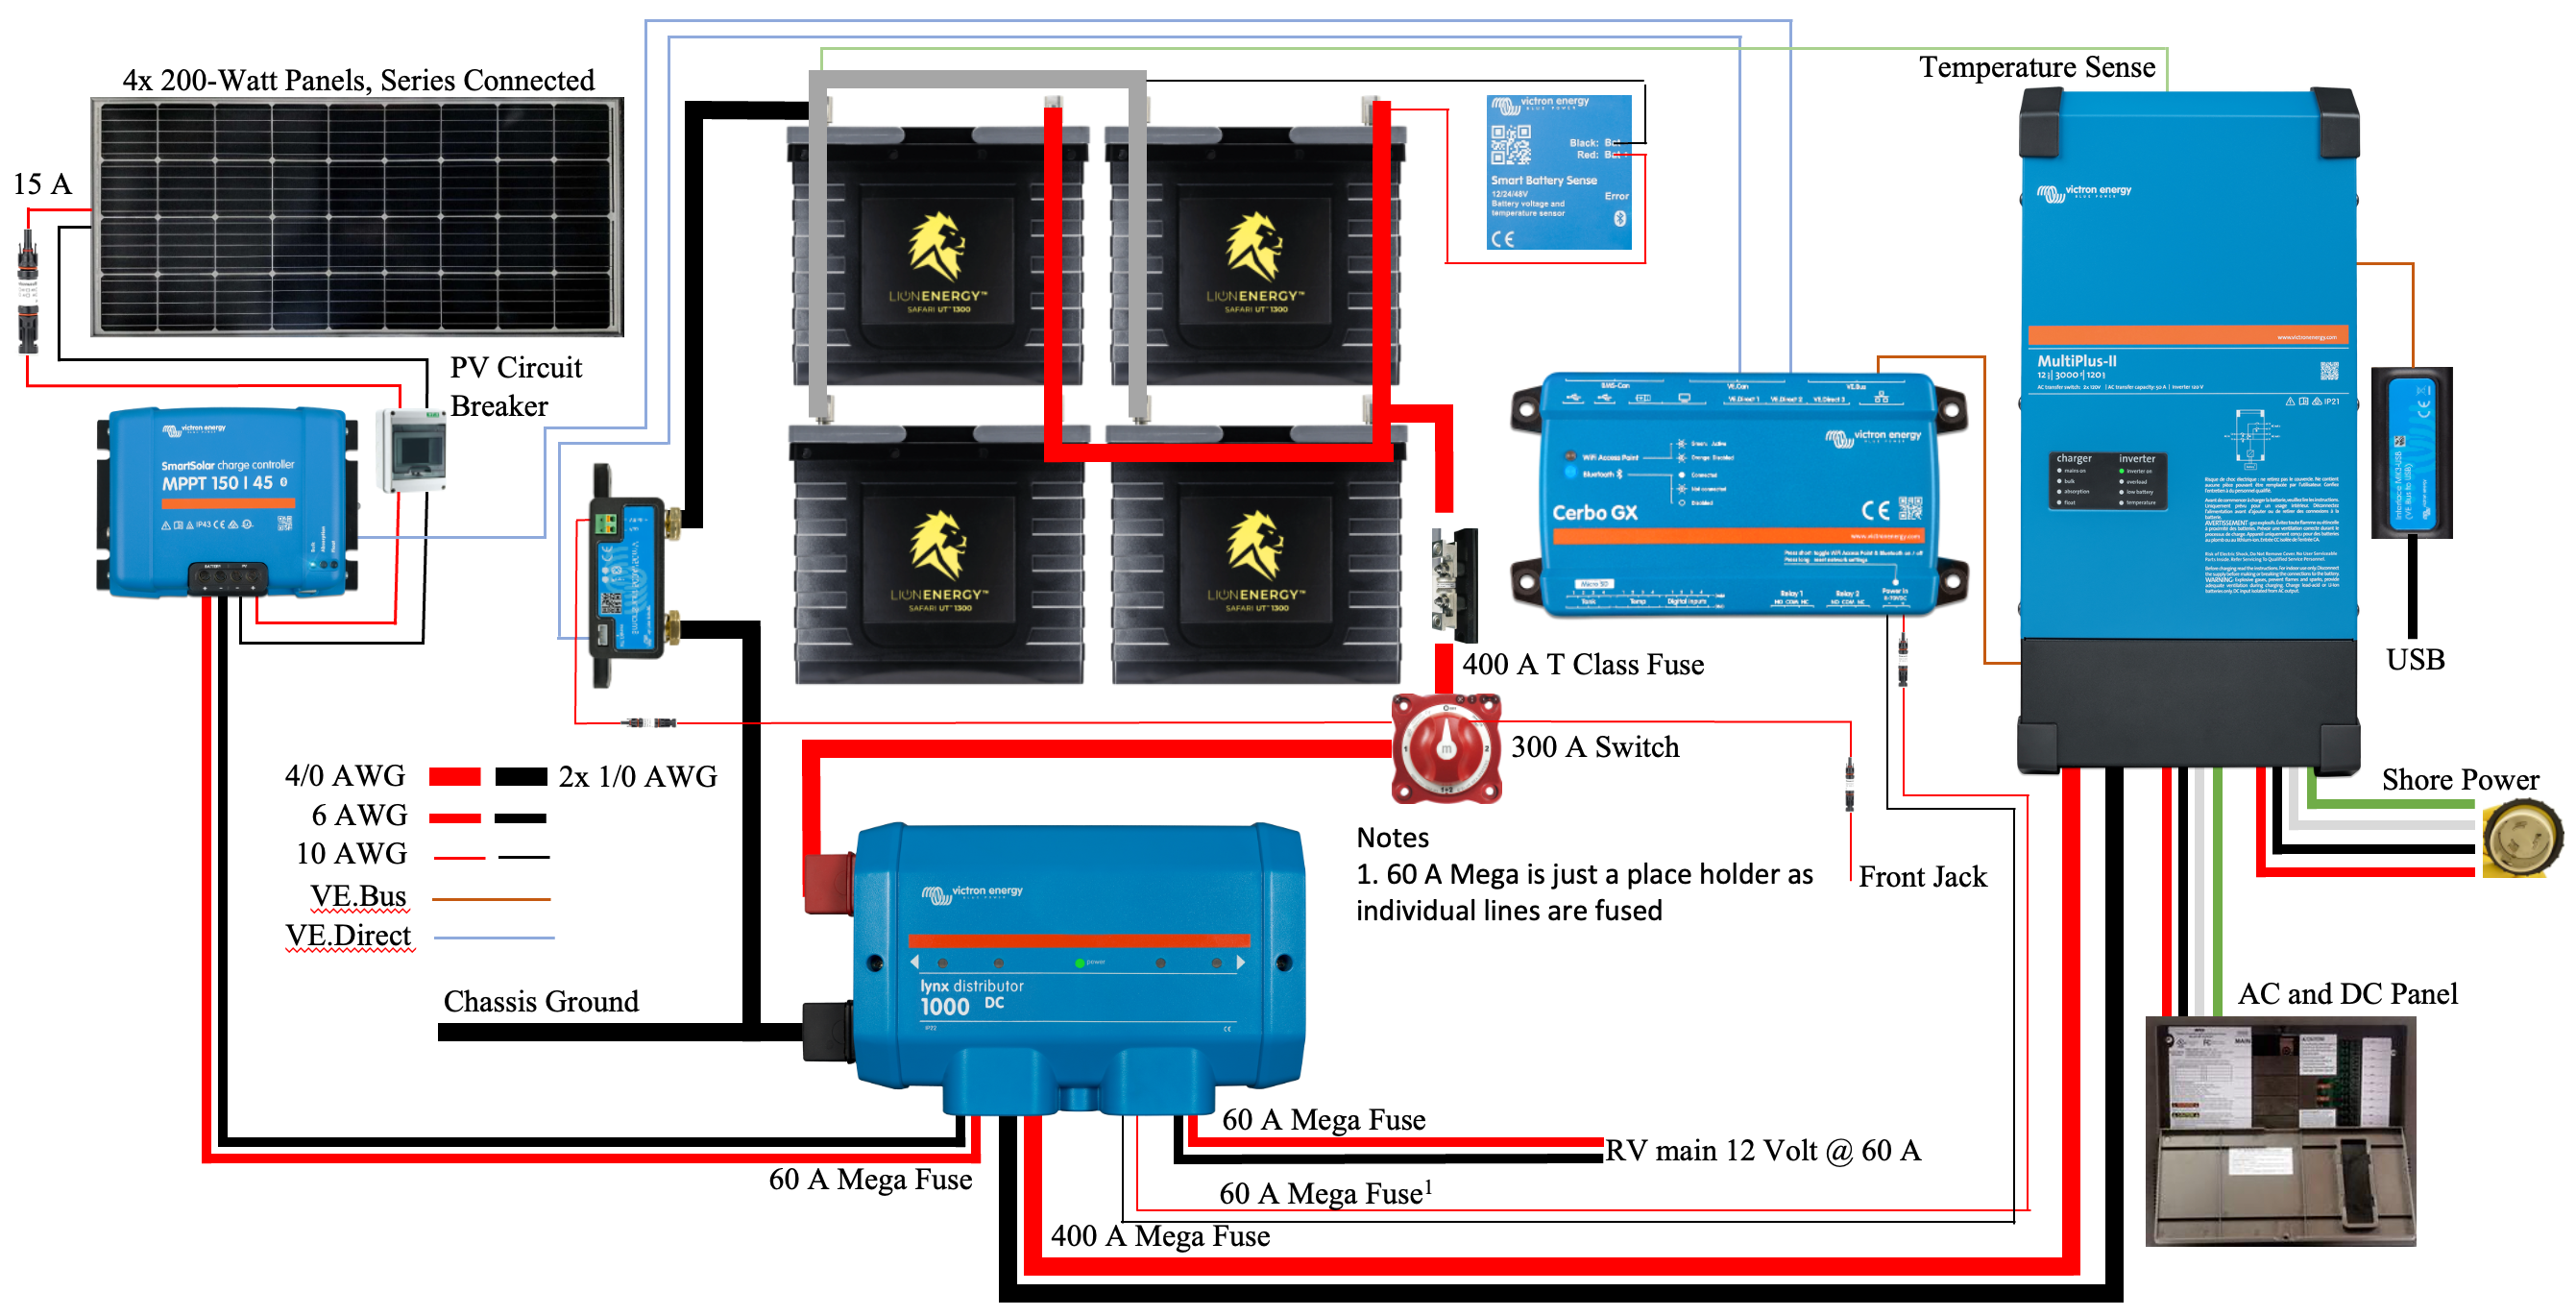
The power system we are endeavoring to build is described in a previous post and illustrated in Figure 6. The critical path in our system is the circuit from the battery bank to the inverter/charger and back. The other system components are essential but generate or consume far less power than the inverter/charger, resulting in lower currents and associated voltage drops.
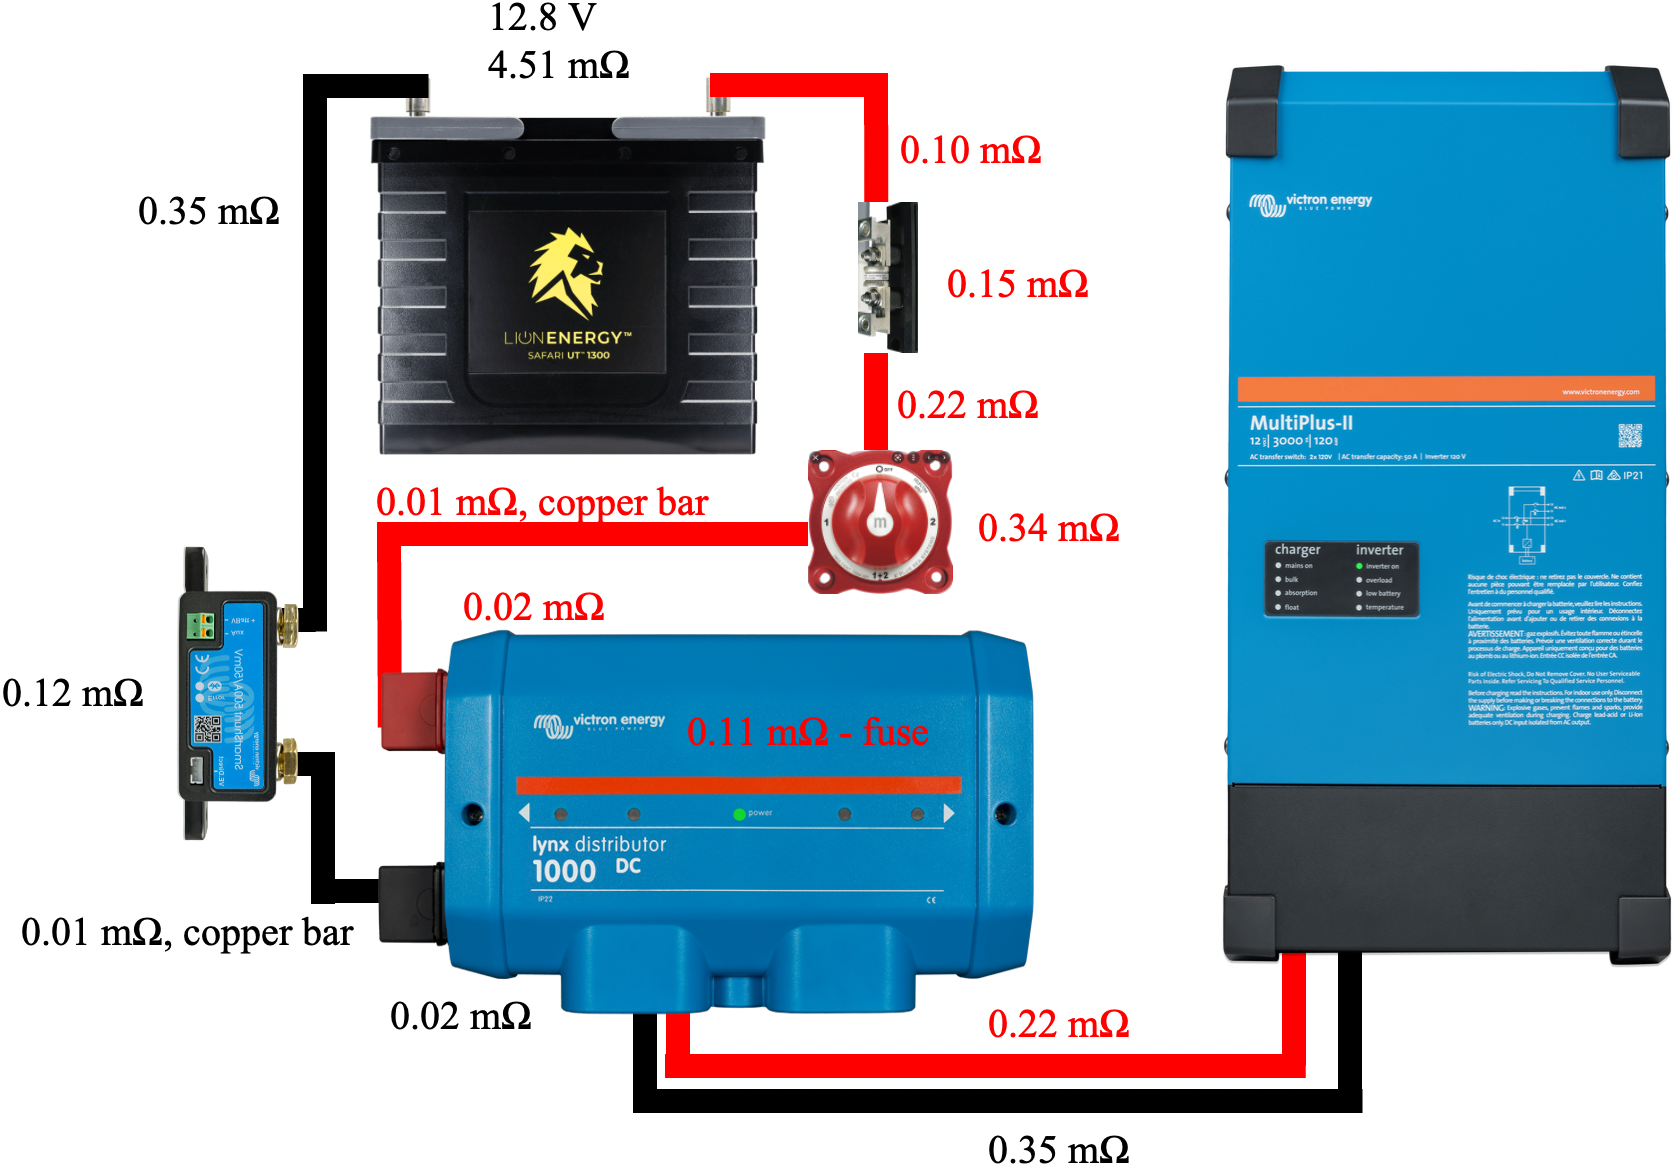
Figure 7 illustrates a simplified schematic of our system, including only the components and 4/0 cables involved in the high current critical path. These 4/0 cables should be capable of carrying 400 A of current. The figure also includes the resistance of each cable and components such as the 400 A class T fuse, battery disconnect switch, shunt, 400 A mega fuse, and the Lynx Distributor busbar system. The cable resistances were measured using the method previously described. Component resistances were obtained by properly torquing a cable of known resistance to each component connection, measuring the resistance from the end of one cable to the end of the other cable, and subtracting the resistance values of the two cables.
In this simplified schematic, we have replaced the battery bank with an image of a single battery with the voltage and resistance values computed using our battery bank model. All resistance values are included in Table 1.
| Component | mΩ |
|---|---|
| 13" 4/0 red cable with lugs crimped to each end. Connects battery bank to fuse holder. | 0.10 |
| 400 A Class T fuse and holder. | 0.15 |
| 38" 4/0 red cable with lugs crimped to each end. Connects fuse holder to battery disconnect switch. | 0.22 |
| Blue Sea 300 A battery disconnect switch | 0.34 |
| Copper bar connecting battery disconnect switch to Lynx Distributor. | 0.01 |
| Victron Lynx Distributor busbar from main connection to first tap. | 0.02 |
| 400 A Mega fuse bolted down within Lynx Distributor. | 0.11 |
| 20" 4/0 red cable with lugs crimped to each end. Connects Lynx Distributor to inverter/charger. | 0.13 |
| 20" 4/0 black cable with lugs crimped to each end. Connects inverter/charger to Lynx Distributor. | 0.19 |
| Victron Lynx Distributor busbar from first tap to main connection. | 0.02 |
| Copper bar connecting Lynx Distributor to SmartShunt. | 0.01 |
| Victron SmartShunt | 0.12 |
| 58" 4/0 black cable with lugs crimped to each end. Connects SmartShunt to battery bank. | 0.35 |
| Total circuit resistance from battery bank | 1.77 |
While not critical to this work, it is interesting to note that according to this table, a 1000′ segment of room temperature 4/0 copper wire has a resistance of 50 mΩ. This implies that our 13″ cable connecting our battery bank to the rest of our system should have a resistance of 0.054 mΩ, yet it measures in at 0.10 mΩ. The crimped lugs contribute the difference of 0.046 mΩ. This implies that each 4/0 crimped lug contributes 0.023 mΩ of resistance. Another interesting fact is that our black 4/0 wires used in our battery bank wiring have a slightly higher resistance than their red equivalents. For example, the black 6.5″ cables have a resistance of 0.10 mΩ while the equivalent red cables have a resistance of 0.08 mΩ.
The total resistance of components and cables around our system’s critical path is 1.77 mΩ. With the inverter powering its maximum load of 3 kVA and just before system shutdown with a battery voltage of 11 V, the system currents would be approximately 273 A. Our system resistance at these high currents would result in a voltage drop of 0.48 V. However, no single system in our RV consumes this much power, and two or more of the large systems would exceed the maximum limit. We expect currents in the 150 A range when either our air conditioner or our microwave oven are operating. At 150 A, our voltage drop will be 0.27 V or 2%, a reasonable figure. Our system should be capable of providing just over 180 A while remaining at or below our 2.5% voltage drop goal.
Summary
Our goal is to create an RV power system that meets our design objectives. One of our goals is to satisfy our power needs while suffering less than a 2.5% voltage drop due to system resistance. This goal will reduce the likelihood of excessive system ripple and other undesirable characteristics. Our system has a critical path resistance of 1.77 mΩ and should supply up to 180 A while staying below a 2.5% voltage drop; this should meet our needs and validate our design’s viability. Next up is the remainder of the implementation.

