This is the ninth post of a series of articles documenting and describing our RV electrical upgrade. Our previous post in this series described a simplified model of our battery bank, the wiring of our system, the resistance contributed by each component and associated cables, and the expected system voltage drop. Our goal is to keep our voltage drop to 2.5% or less as recommended in Victron’s Wiring Unlimited. This post describes the outcome, reports actual voltage drop measurements, and compares these with those calculated previously. Finally, we evaluate our final results regarding our initial goals, point out a few things we’d do differently, and conclude. For those interested, this page lists the parts, equipment, and tools we used to build our power system.
Initial Design
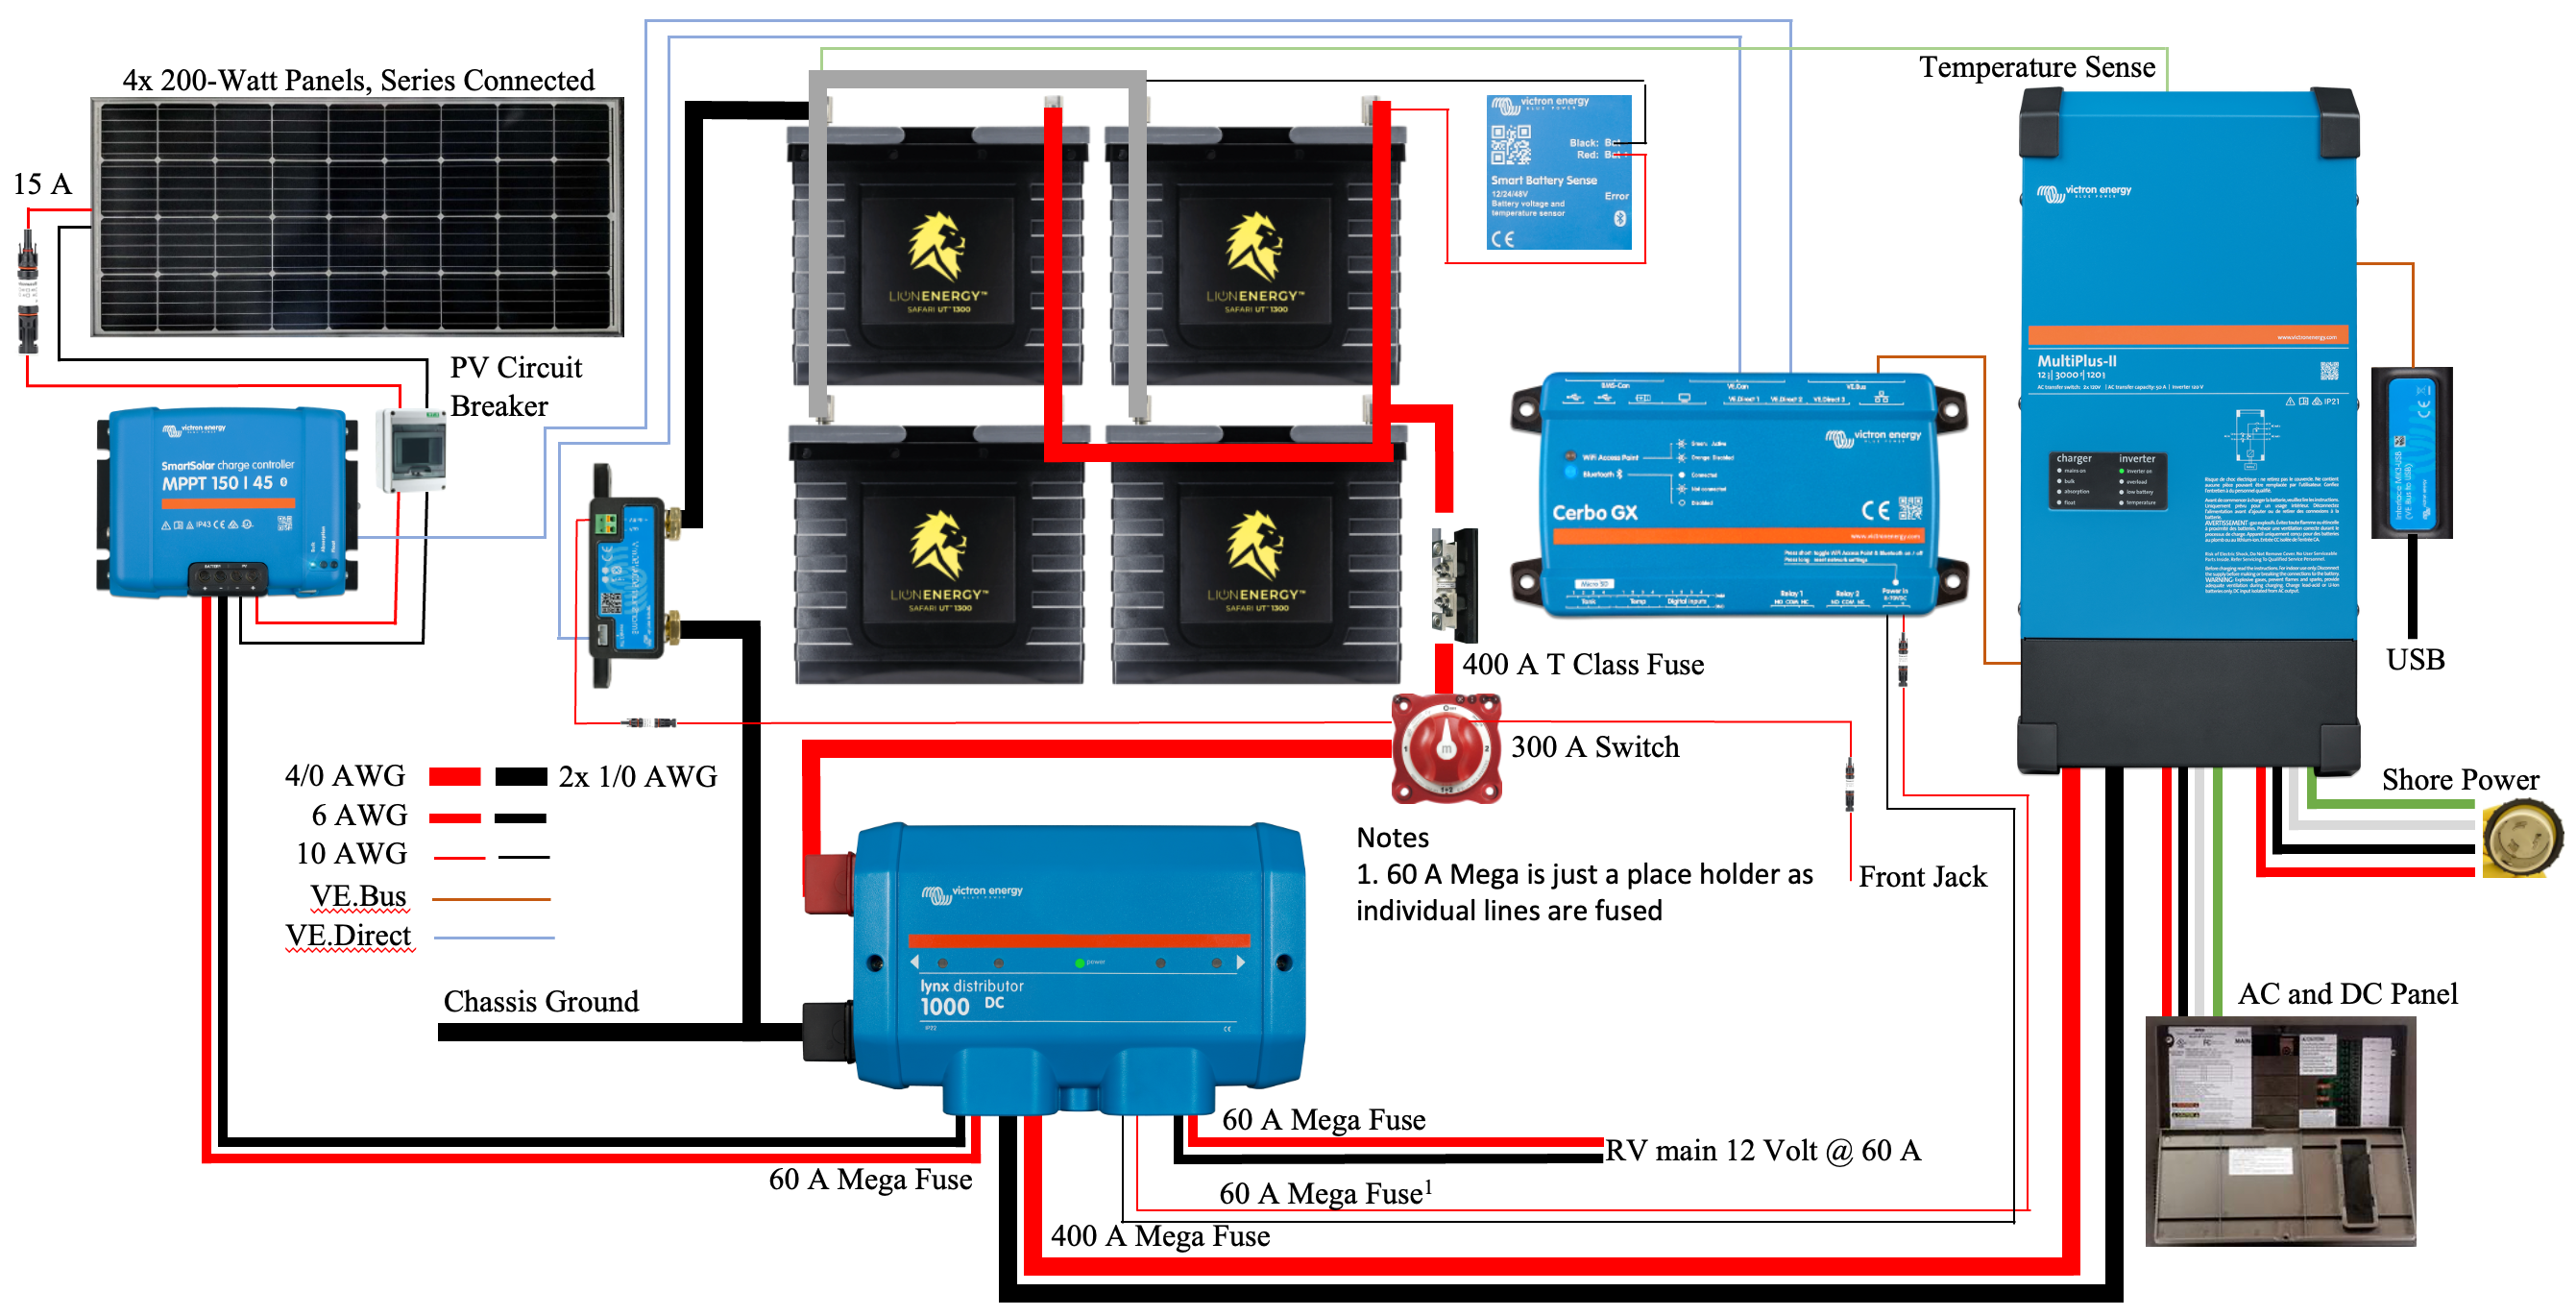
The power system we built, illustrated in Figure 1, was initially proposed in one of our first posts in this series. In our previous post, we introduced the critical path of this system consisting of the circuit from the battery bank to the inverter/charger and back, illustrated in Figure 2.
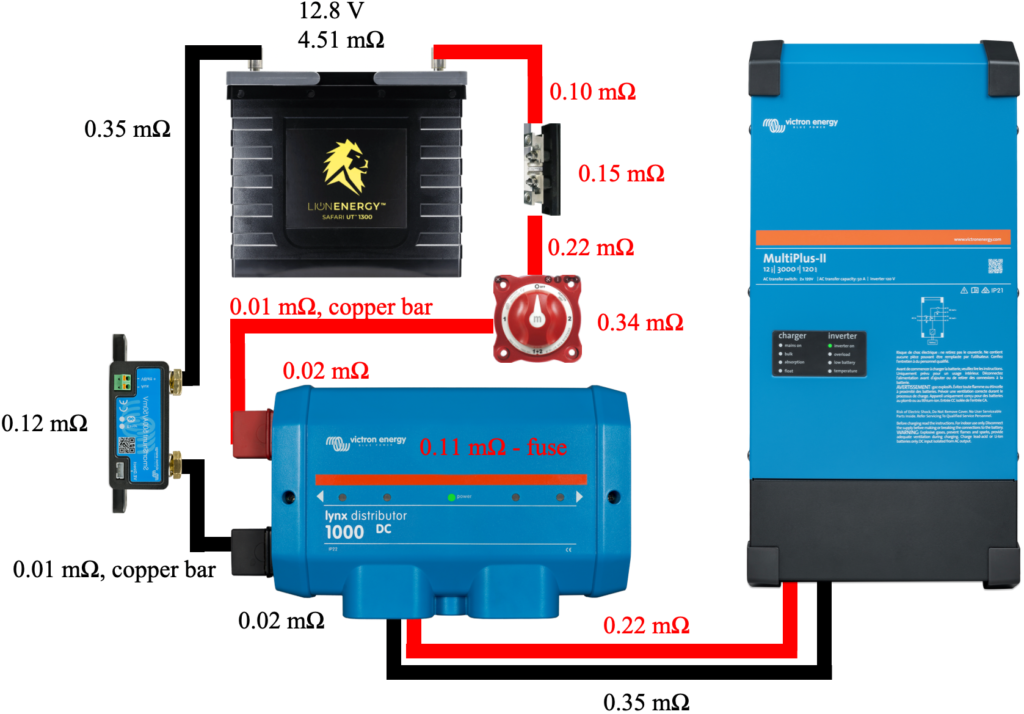
Figure 2 includes the measured resistance of each cable and component, such as the 400 A class T fuse, battery disconnect switch, shunt, 400 A mega fuse, and the Lynx Distributor busbar system. These resistances are assumed to be worst-case values as we rounded up measurements and the measurement device’s connection to each component was simply the tension applied by the spring-loaded probes. The total measured resistance of components and cables around our system’s critical path is 1.77 mΩ. With this resistance, we concluded that our system should be capable of providing just over 180 A while remaining at or below our 2.5% voltage drop goal.
Final System
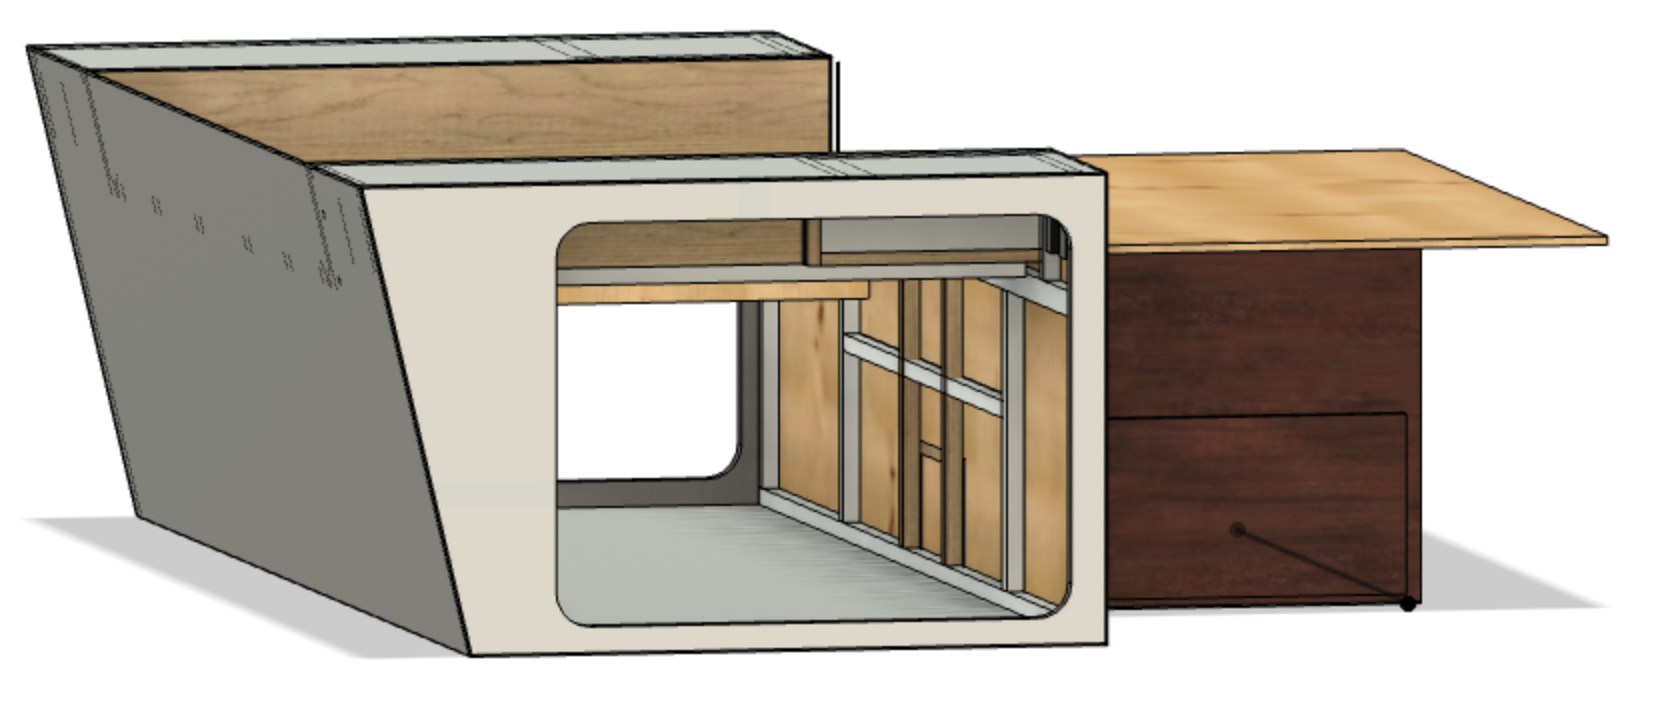
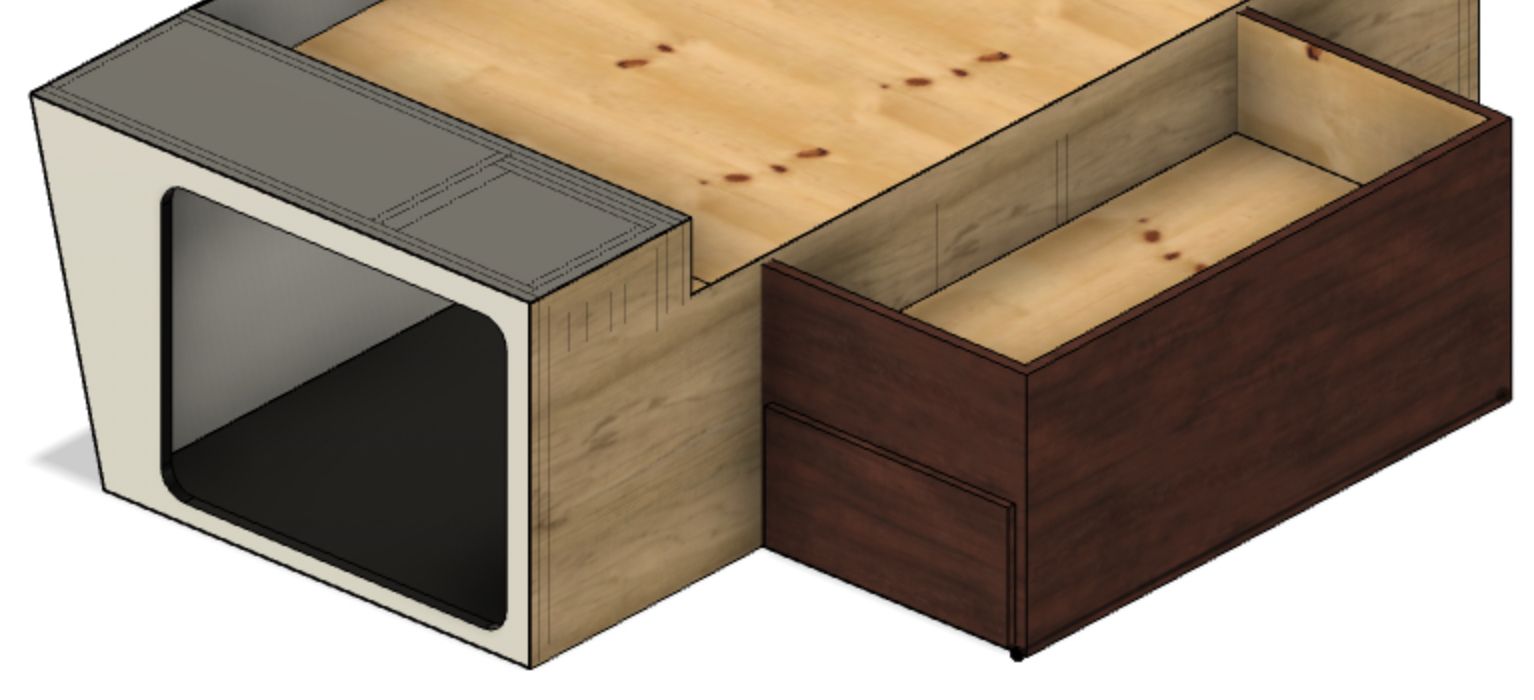
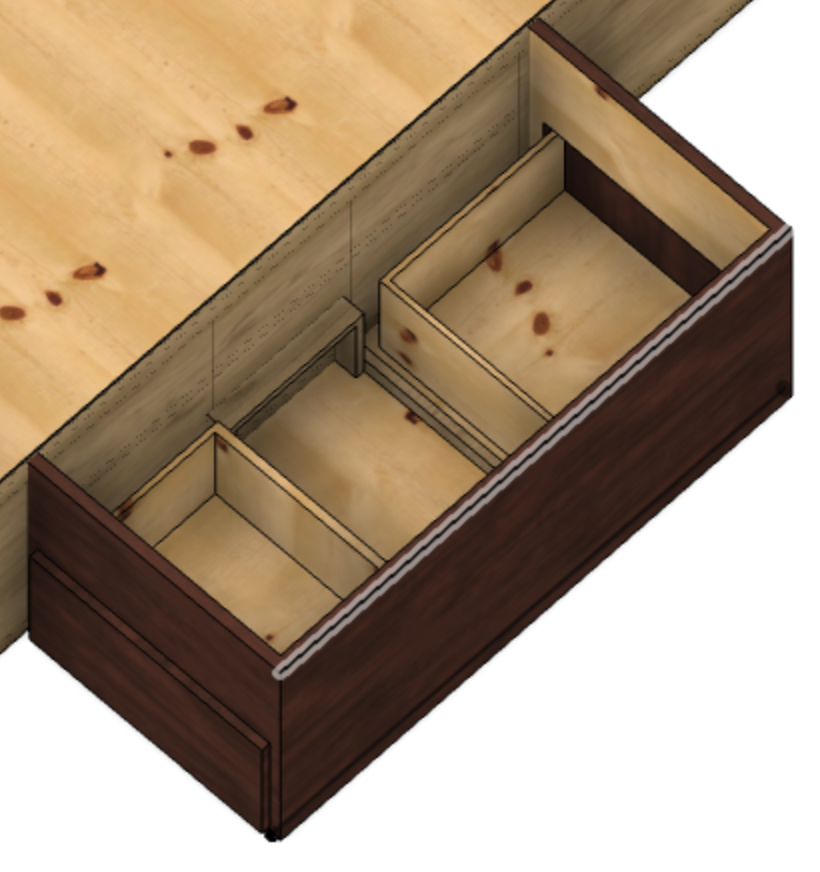
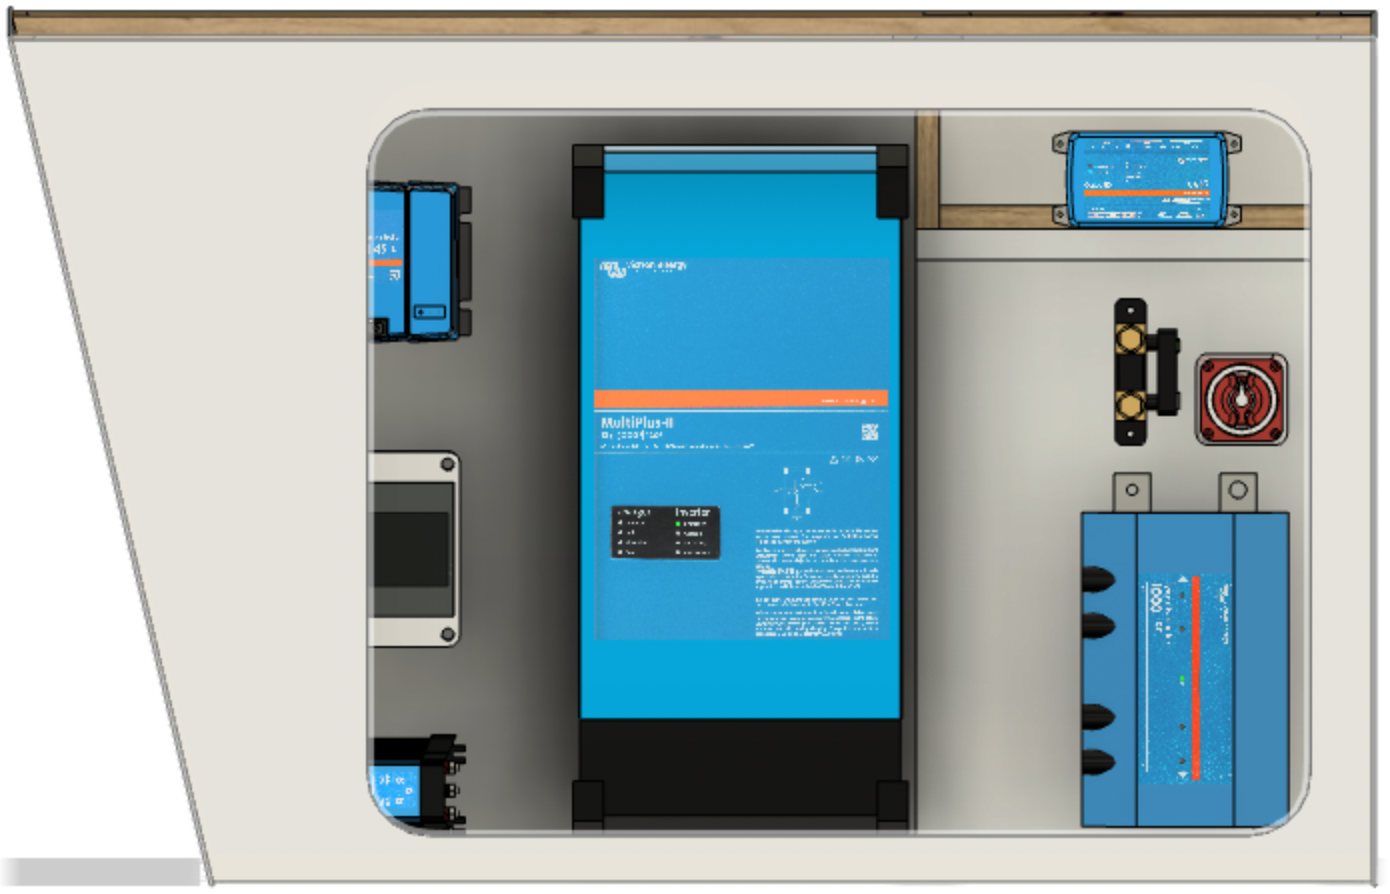
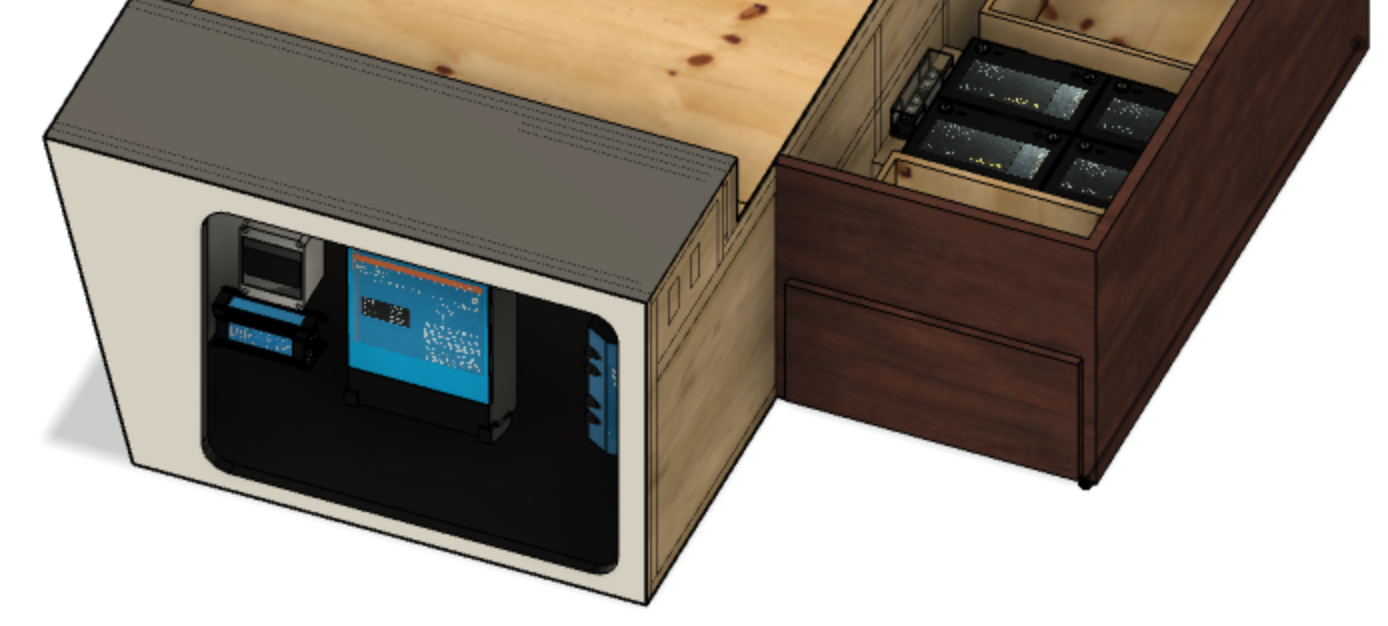
After considerable cold winter work, our design came to fruition. As previously described, our power system fits within the left pass-through storage area, illustrated in Figure 3.
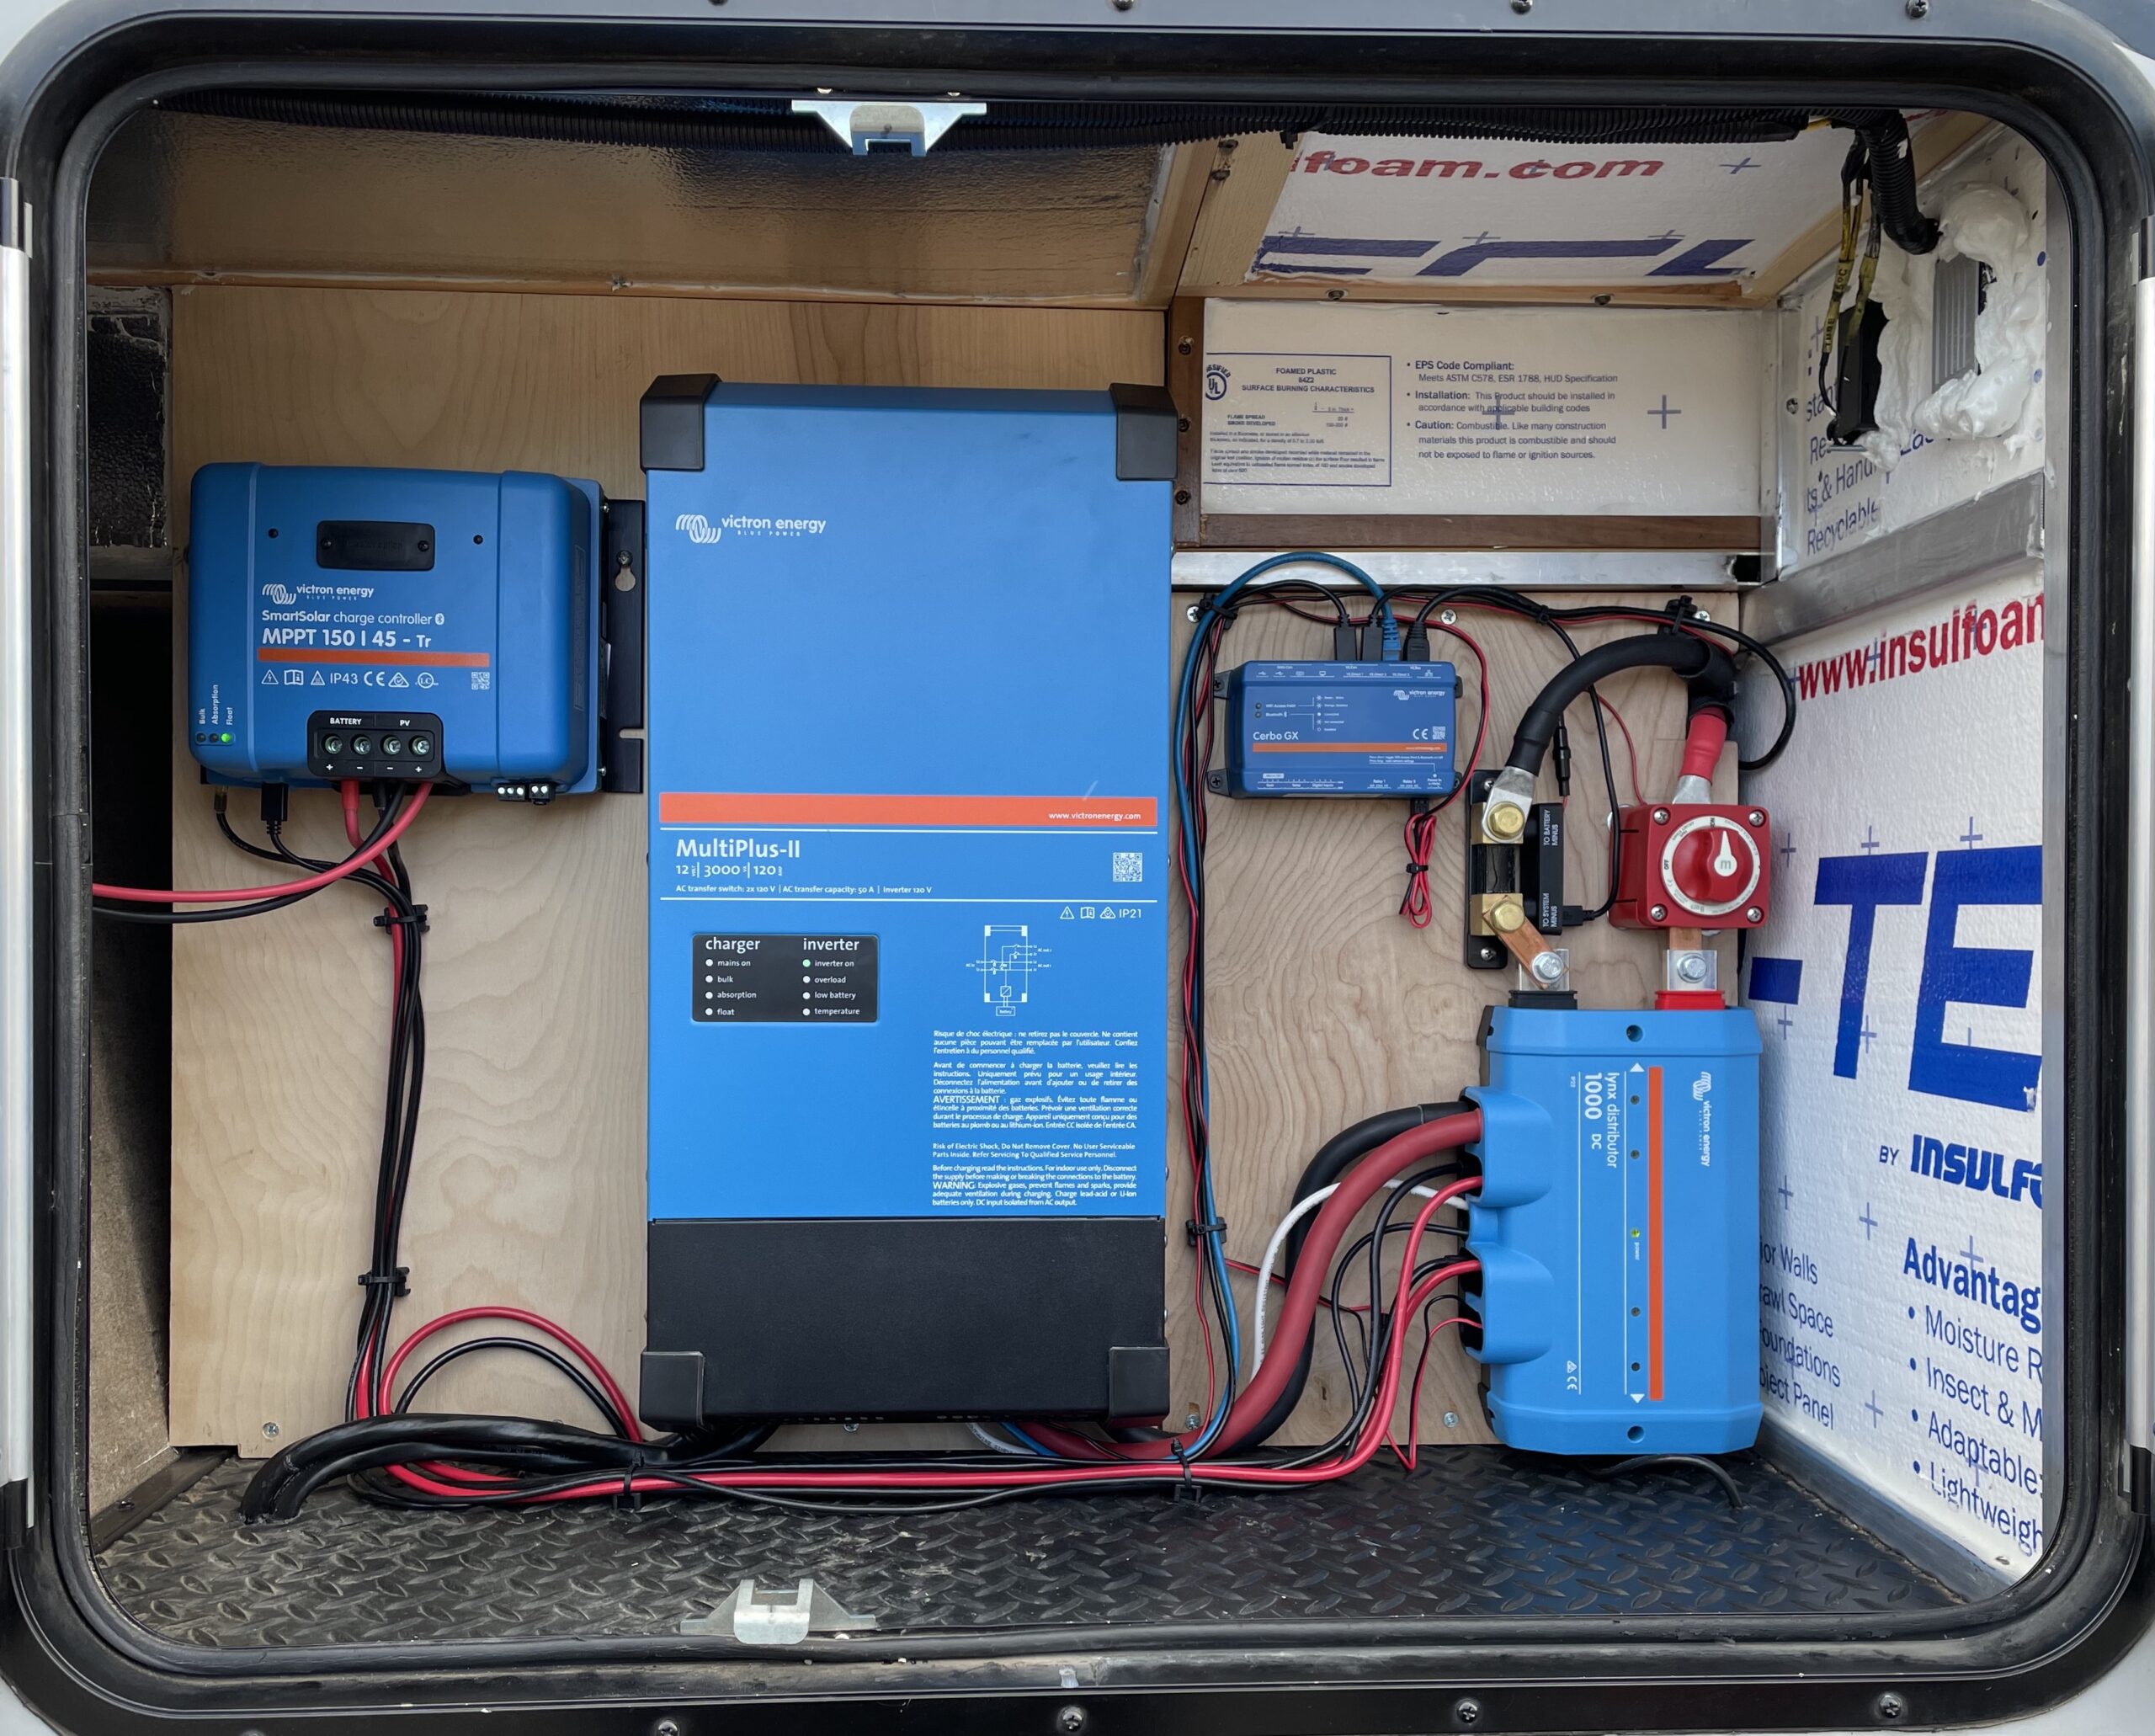
Figure 3 illustrates the major components of our system. There are seven major components illustrated from upper left to lower right:
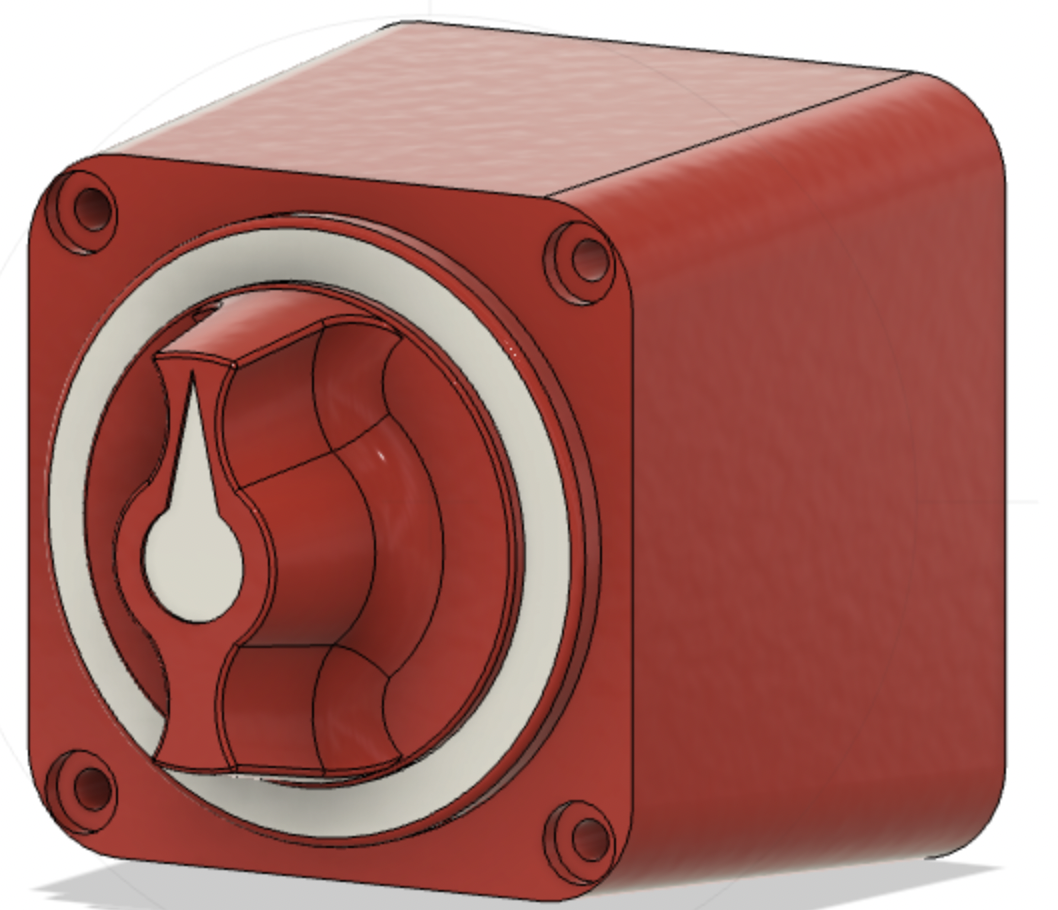
- Solar PV disconnect switch
- Victron SmartSolar 150/45 solar charger
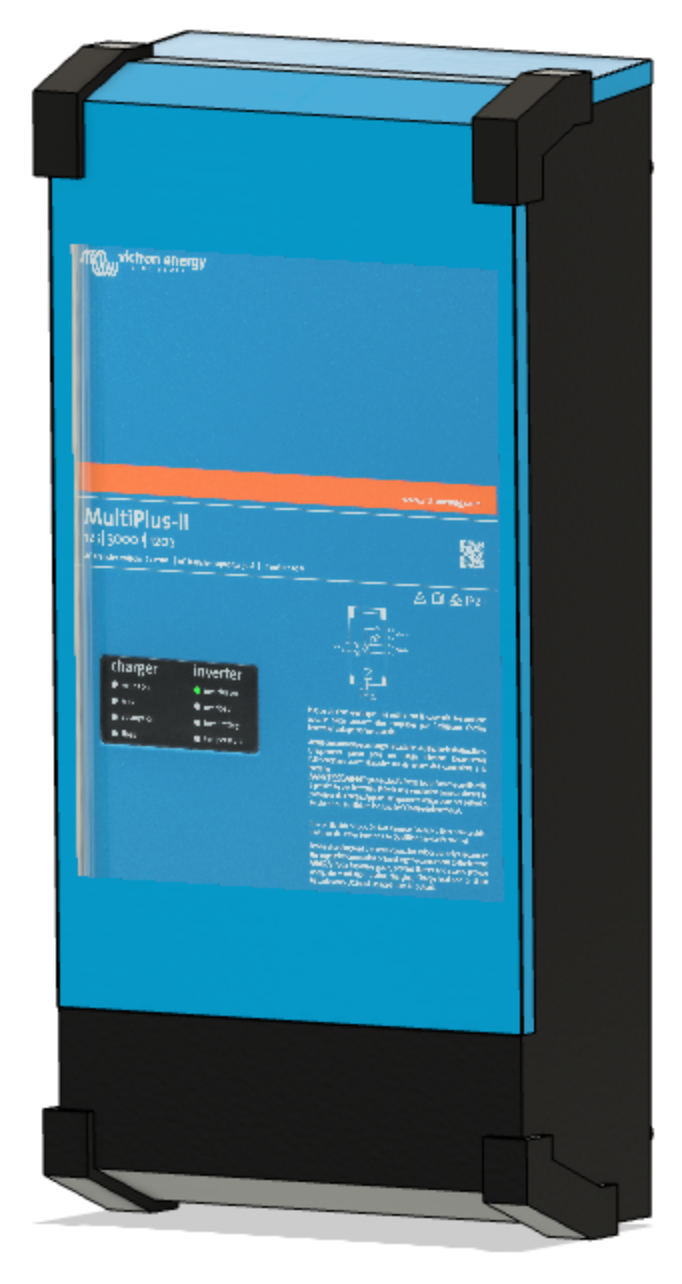
- Victron MultiPlus-II 2x 120V inverter/charger
- Victron Cerbo GX monitoring system
- Victron SmartShunt
- Blue Sea battery switch
- Victron Lynx Distributor
Our battery bank is behind and to the right of this location. The solar charger and the SmartShunt attach to the Cerbo GX via VE.Direct cables. The battery voltage monitor (mounted on the battery bank) and the MultiPlus-II connect to the Cerbo GX via two VE.Bus cables.
We used a Victron MK3-USB device to program the inverter/charger for our specific setup and then used the remote console provided by the Cerbo GX to monitor the initial startup. After turning on the battery switch and the solar PV switch, the system immediately started providing inverted power to the RV, and the solar charger started charging the batteries. Next, using a halogen light and my wife’s toaster, we applied some moderate load to the system and took some readings, found in Table 1.
| Battery Voltage | Inverter Voltage | Voltage Drop | Current (A) | Resistance mΩ |
|---|---|---|---|---|
| 12.88 | 12.84 | 0.04 | 25 | 1.6 |
| 12.71 | 12.61 | 0.10 | 73 | 1.4 |
| 12.28 | 12.04 | 0.24 | 157 | 1.5 |
As expected, as the system current increases, the voltage drop experienced by the inverter/charger increases. We divided the voltage drop by the associated system current to calculate the system resistance. Averaging these three values, we note that the system resistance is 1.5 mΩ which is 0.27 mΩ lower than the measured 1.77 mΩ.
The system experienced a 0.24 V voltage drop with a 157 A load. A voltage drop of 0.24 V is a percentage voltage drop of just 1.9%, well below our limit of 2.5%. With a resistance of only 1.5 mΩ, we should be able to load our system to nearly 215 A without exceeding our 2.5% goal. These 5-10 minute load tests resulted in almost no heat generation by the inverter/charger or any system components. I am looking forward to more extended tests to see how hot things get.
Summary: How Did We Do
Nearly three months ago, we outlined our goals for our new power center in our first post on this subject. We desired the ability to use our microwave, television, and other 120 V AC systems without having to ruin our camping solitude with a generator. In addition, we wanted to minimize the intrusion of our generator while recharging our batteries. We determined that to meet our needs, we needed several items:
- 400 Ah of lithium-ion batteries
- 800 Watts of solar power
- An inverter that is capable of producing nearly 3000 Watts of 120 V AC power
- A battery charger that is capable of consuming our entire generator output to minimize charge time
We have nearly met each of these requirements. Instead of 400 Ah of batteries, we have 360 Ah, and instead of 3000 W of inverter power, we have 3000 VA or 2400 W continuous. We believe each is close enough to call this project a success. Perhaps more importantly, we learned a lot on the journey and had a lot of fun. If our RV needs to be restored to what we had before this project, here is a brief description of the required tasks.
We did a couple of things right and a few we’d do differently with the new knowledge we possess:
- We can’t properly express how great the copper bar approach to connecting the battery disconnect switch and the SmartShunt to the Victron Lynx Distributor is. Using a short segment of 4/0 wire and a lug at each end results in a rather long connection. The copper bar approach saves space, looks clean, and in our cramped environment made our layout possible. You could save ten bucks if you want to make your own, but we saved ourselves the cutting, drilling, and the likely mistakes and bought a pair.
- I wouldn’t have initially skimped on our torque wrench purchase. Our fitst purchase had a torqu range of 10-100 ft-lbs and barely registered when being used at the low end. We ended up twisting a bolt head on a battery lug clean off. This was dangerous and could have resulted in a bolt being unretrievable from an expensive battery. Fortunately, just enough bolt was left to enable its removal with a pair of vicegrips. We love our second torque wrench, the Park Tool TW-6.2.
- We would definitely use boat/marine wire instead of the 6/3 Romex that we installed. Our RV, like most, is full of Romex making us comfortable that this was a reasonable choice. In addition, 6/3 Romex contains stranded conductors, but not like ultra flexible boat/marine wire such as Ancor’s Triplex Cable.
- We would have used lugs suggested by Victron Energy. The 4/0 sized lugs we used are great, but don’t fit very well within the Victron Lynx Distributor. I suspect, but have no evidence that the lugs they suggest would fit much better.
We’re done, it looks clean and neat, and above all else, it works!